NASDAQ 100, 13,000

NASDAQ 100
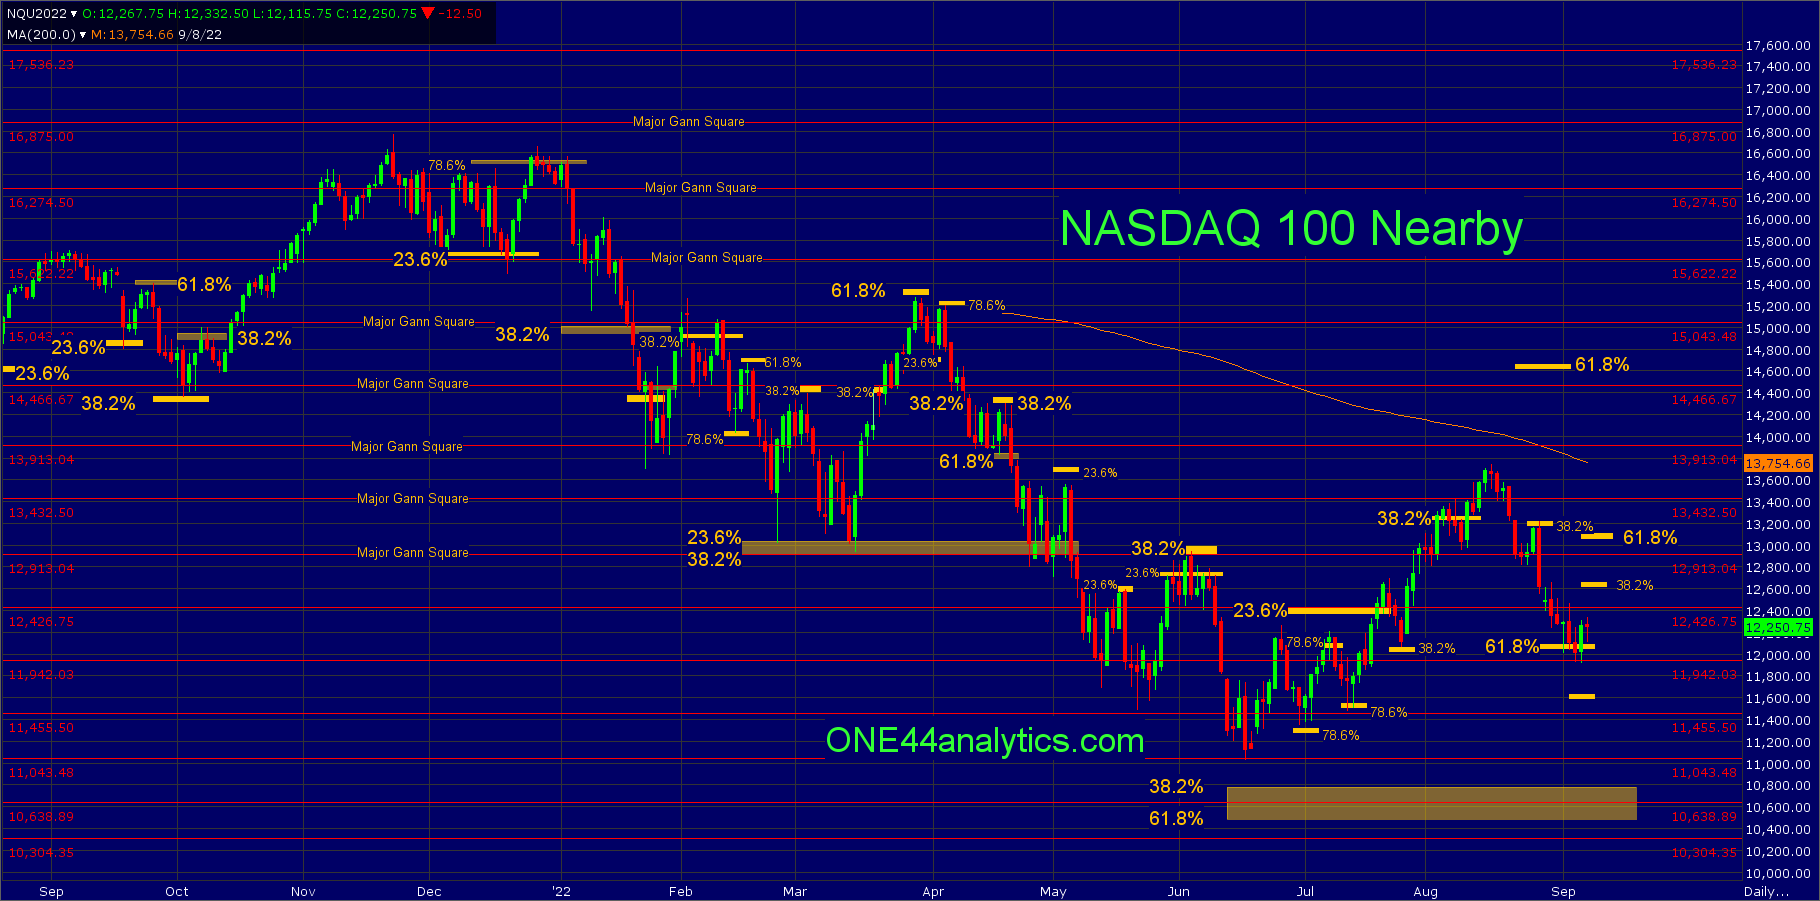
We will deal with the Nearby chart so that we can get the full history of trade.
You can go back on the chart below and see the importance of the major Gann squares and Fibonacci retracements for finding support and resistance. We have done previous posts on what the levels were and what to look for when they hold and when they don't, following the ONE44 Fibonacci rules and guidelines on our website.
Currently,
The low this week has held 61.8% of the 6/16/22 low and 8/16/22 high, this level is 12,050 and the 11,942 major Gann square. When we use the ONE44 61.8% rule,
Whenever the market holds 61.8% of a move, look for it to go 61.8% of where it just came from. This usually happens when a market is directionless, or in a consolidation period.
We get a target of 61.8% the other way at 13,000. This is the longer term target and as always we watch all the retracements on every move to see just how strong, or weak the market is, so any rally from 12,050 that can't get above 38.2% at 12,650 would be a negative sign and you can look for new lows for the move. On a failure to produce a rally from 12,050 and a close below it, the target will be 78.6% of the same move at 11,600. On an extended break, look for the long term retracements of 10,800 to 10,500. This is 38.2% back to the 2009 low and 61.8% back to the 2020 low.
FULL RISK DISCLOSURE: Futures trading contains substantial risk and is not for every investor. An investor could potentially lose all or more than the initial investment. Commission Rule 4.41(b)(1)(I) hypothetical or simulated performance results have certain inherent limitations. Unlike an actual performance record, simulated results do not represent actual trading. Also, since the trades have not actually been executed, the results may have under- or over-compensated for the impact, if any, of certain market factors, such as lack of liquidity. Simulated trading programs in general are also subject to the fact that they are designed with the benefit of hindsight. No representation is being made that any account will or is likely to achieve profits or losses similar to those shown. Past performance is not necessarily indicative of future results.