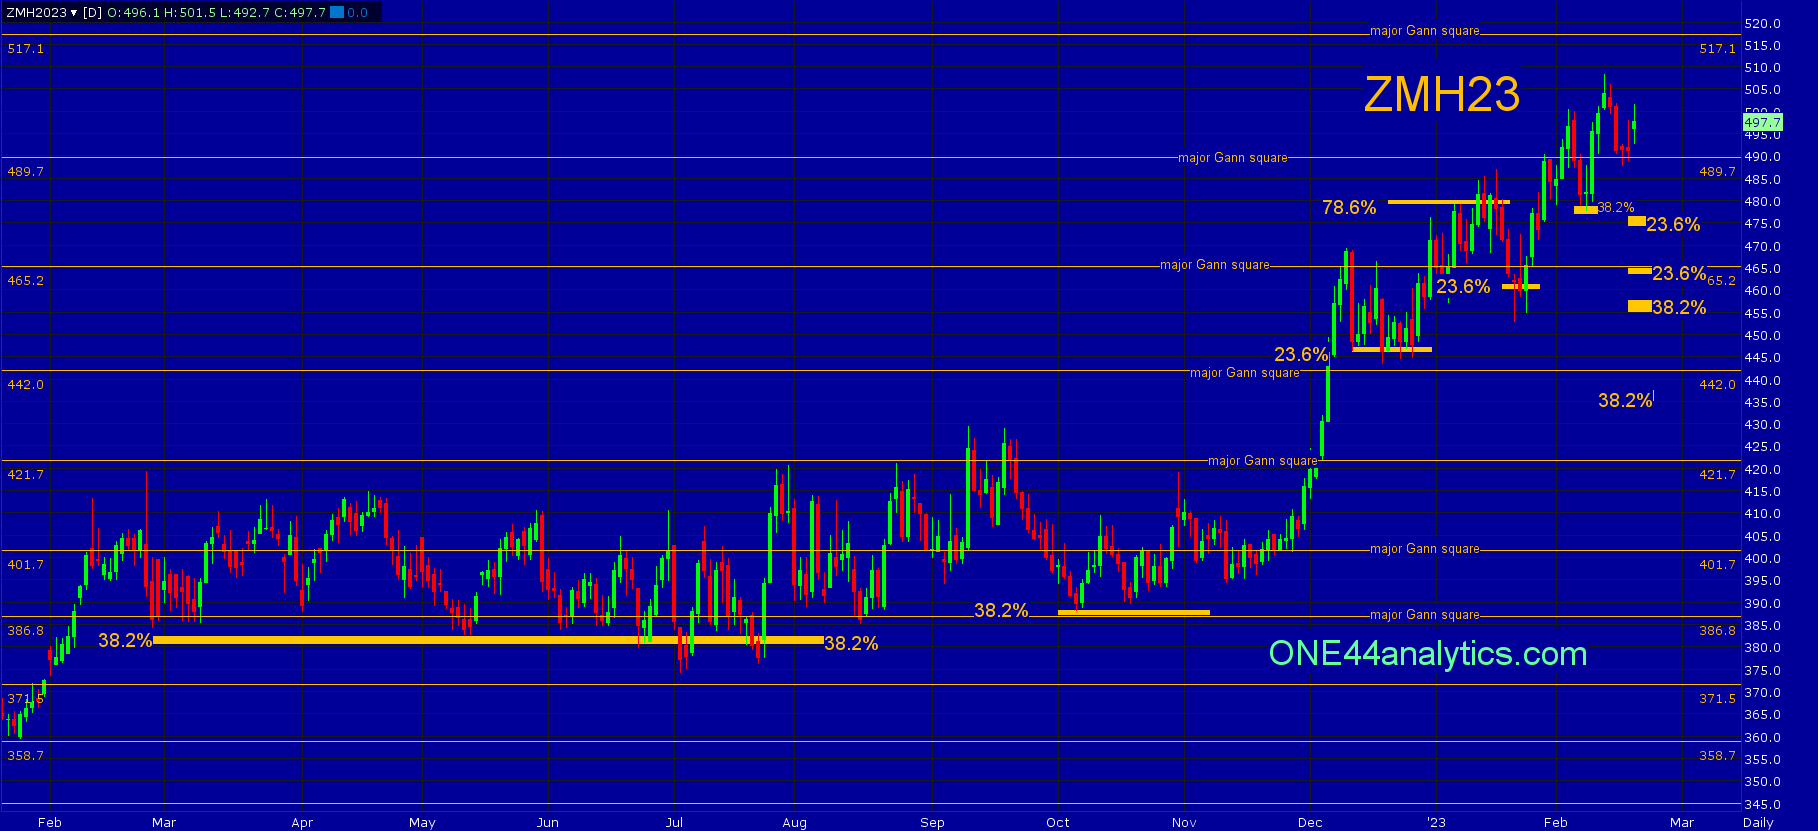
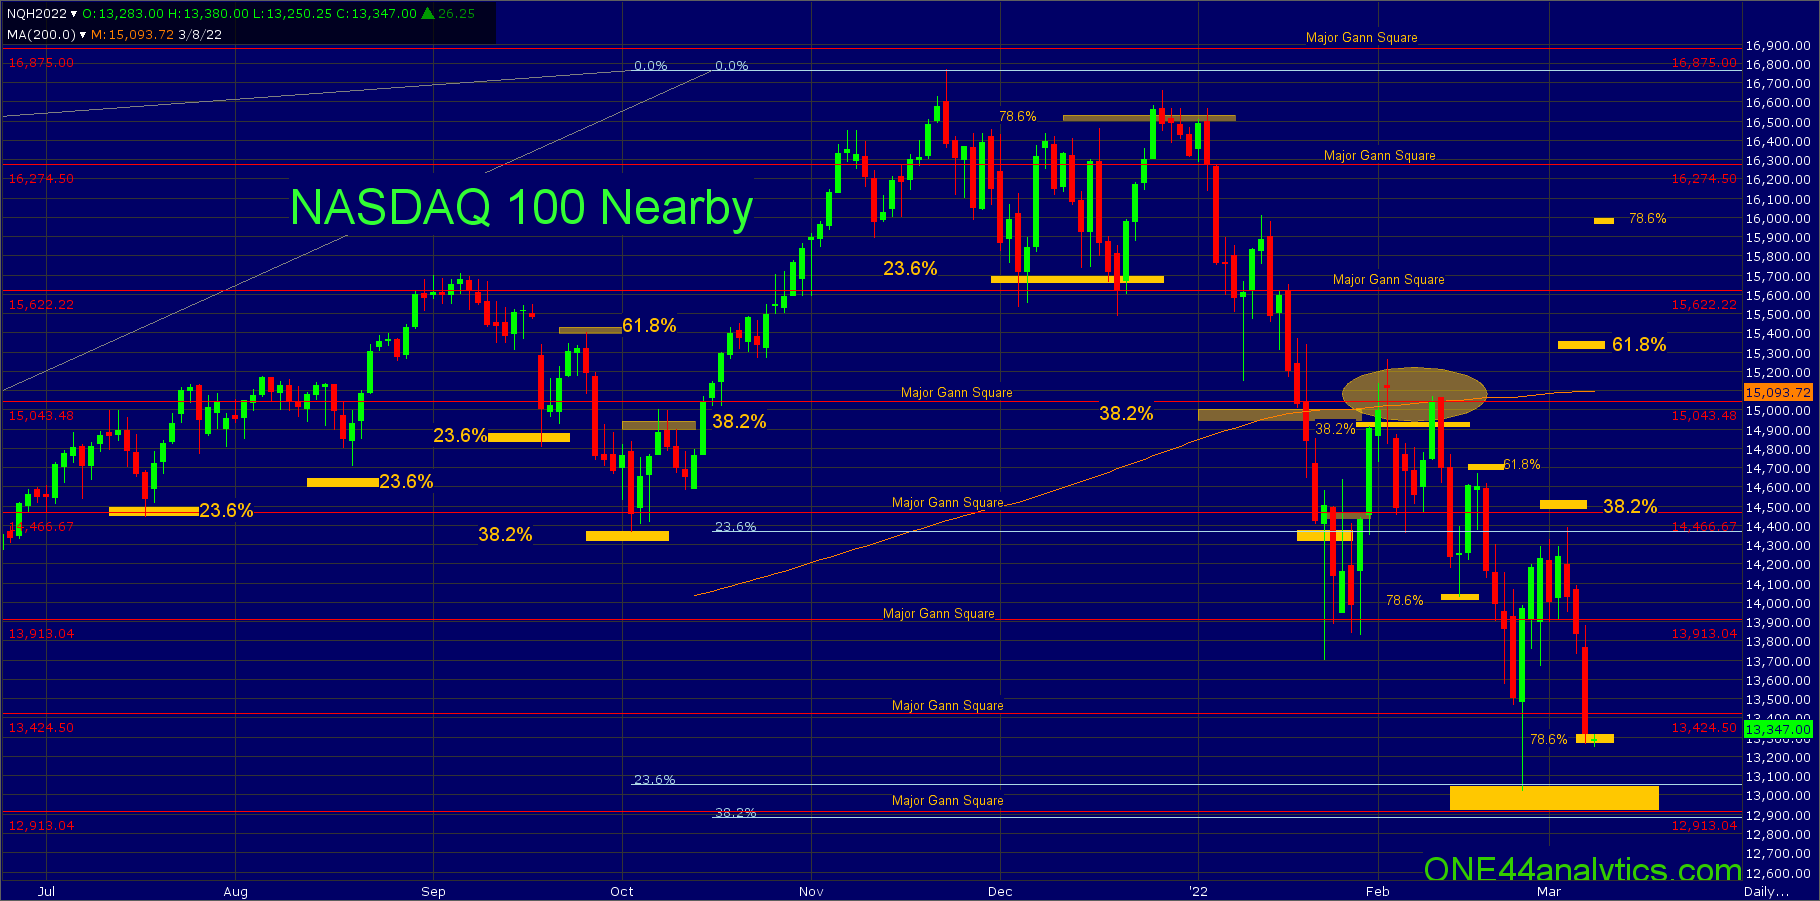
Members only ONE44 in 360 ONE44 in 360 This is another video, in a series of them, explaining how to use the Fibonacci retracements with the ONE44 rules and guidelines. In this one we are using Soybean Meal and NASDAQ100
nasdaq 100 Can The NASDAQ 100 Get Another Rally Going From The Long Term Retracements Back To The 2020 And 2009 Lows? NASDAQ 100 (NQH23) Can the NASDAQ 100 get another rally going from the long term retracements going back to the 2020 and 2009 lows? The low on 11/4/22, failed to make a new low and held the long term retracements of 10,800 and 10,500, this was
nasdaq 100 NASDAQ 100, 13,150 target ONE44 Analytics where the analysis is concise and to the point Our goal is to not only give you actionable information, but to help you understand why we think this is happening based on pure price analysis with Fibonacci retracements, that we believe are the underlying structure of all markets
nasdaq 100 NASDAQ 100, 13,000 NASDAQ 100 (NQU22) We will deal with the Nearby chart so that we can get the full history of trade. You can go back on the chart below and see the importance of the major Gann squares and Fibonacci retracements for finding support and resistance. We have done previous posts
Fibonacci Retracements NASDAQ 100, Russell 2000 Hit Major Swing Points Provided you have been following the ONE44 Fibonacci rules and guidelines in all of our previous posts, you know the Golden Rule is, 38.2% is the single most important retracement and is the level we use for the "Golden Rule". This rule being, " any market that
Fibonacci Retracements NASDAQ 100, 10,800 target.... NASDAQ 100 (NQM22) This is an ongoing series of updates on how the Fibonacci retracements with the ONE44 rules and guidelines work in this market and ALL markets. In our last update on 4/22/22 we left you with this, The highs on 4/20/22 and 4/23/
Fibonacci NASDAQ 100, it's all Fibonacci NASDAQ 100 (NQM22) This is an ongoing series of updates on how the Fibonacci retracements with the ONE44 rules and guidelines work in this market and ALL markets. In our last update on 4/14/22 we left you with this, As you can see on the chart the 38.
Fibonacci Retracements NASDAQ 100, 61.8% to 38.2%, it's all Fibonacci NASDAQ 100 (NQM22) This is an ongoing update of the NASDAQ 100, our last one was on 4/2/22. In it we left you with, The break from 15,300 (61.8%) has now taken it to 23.6% of the recent rally at 14,725, if this is
nasdaq 100 NASDAQ 100 and the break from 61.8% NASDAQ 100 (NQM22) This is an ongoing update to where the market has been and is now going. We highly recommend that you go back and read all the past posts, so you can see why we are, where we are and all posted ahead of the turns in the
Fibonacci NASDAQ 100, 61.8% target hit, 15,300 ONE44 Analytics where the analysis is concise and to the point NASDAQ 100 (NQM22) This is an update to "NASDAQ 100, 38.2% to 38.2%, now what?" We highly recommend that you go back and read all the past posts, so you can see why we are,
Fibonacci NASDAQ 100, 38.2% to 38.2%, now what? NASDAQ 100 (NQM22) In our post on 2/26/22 This is what caused the massive turnaround in the NASDAQ 100 we showed what levels turned this market back up and what to look for. This is what we left you with, A failure to get above 38.2% will
nasdaq 100 NASDAQ 100, is this the start of a run up to 15,300 ONE44 Analytics where the analysis is concise and to the point NASDAQ 100 (NQH22) In our last post NASDAQ 100 fails first test we showed you what caused the sharp rally up from 13,050 to just short of 38.2% back to the ATH and we left you with
Fibonacci NASDAQ 100 fails first test ONE44 Analytics where the analysis is concise and to the point NASDAQ 100 (NQH22) In our last post on 2/26/22 we left you with this.. With 13,060 being 23.6% back to the 2008 low, we know following the ONE44 Fibonacci rules that holding 23.6% should
Fibonacci This is what caused the massive turnaround in the NASDAQ 100 ONE44 Analytics where the analysis is concise and to the point Our goal is to not only give you actionable information, but to help you understand why we think this is happening based on pure price analysis with Fibonacci retracements, that we believe are the underlying structure of all markets