NASDAQ 100, 13,150 target

ONE44 Analytics where the analysis is concise and to the point
Our goal is to not only give you actionable information, but to help you understand why we think this is happening based on pure price analysis with Fibonacci retracements, that we believe are the underlying structure of all markets and Gann squares.
NASDAQ 100
In our last update on 9/8/22 we left you with this,
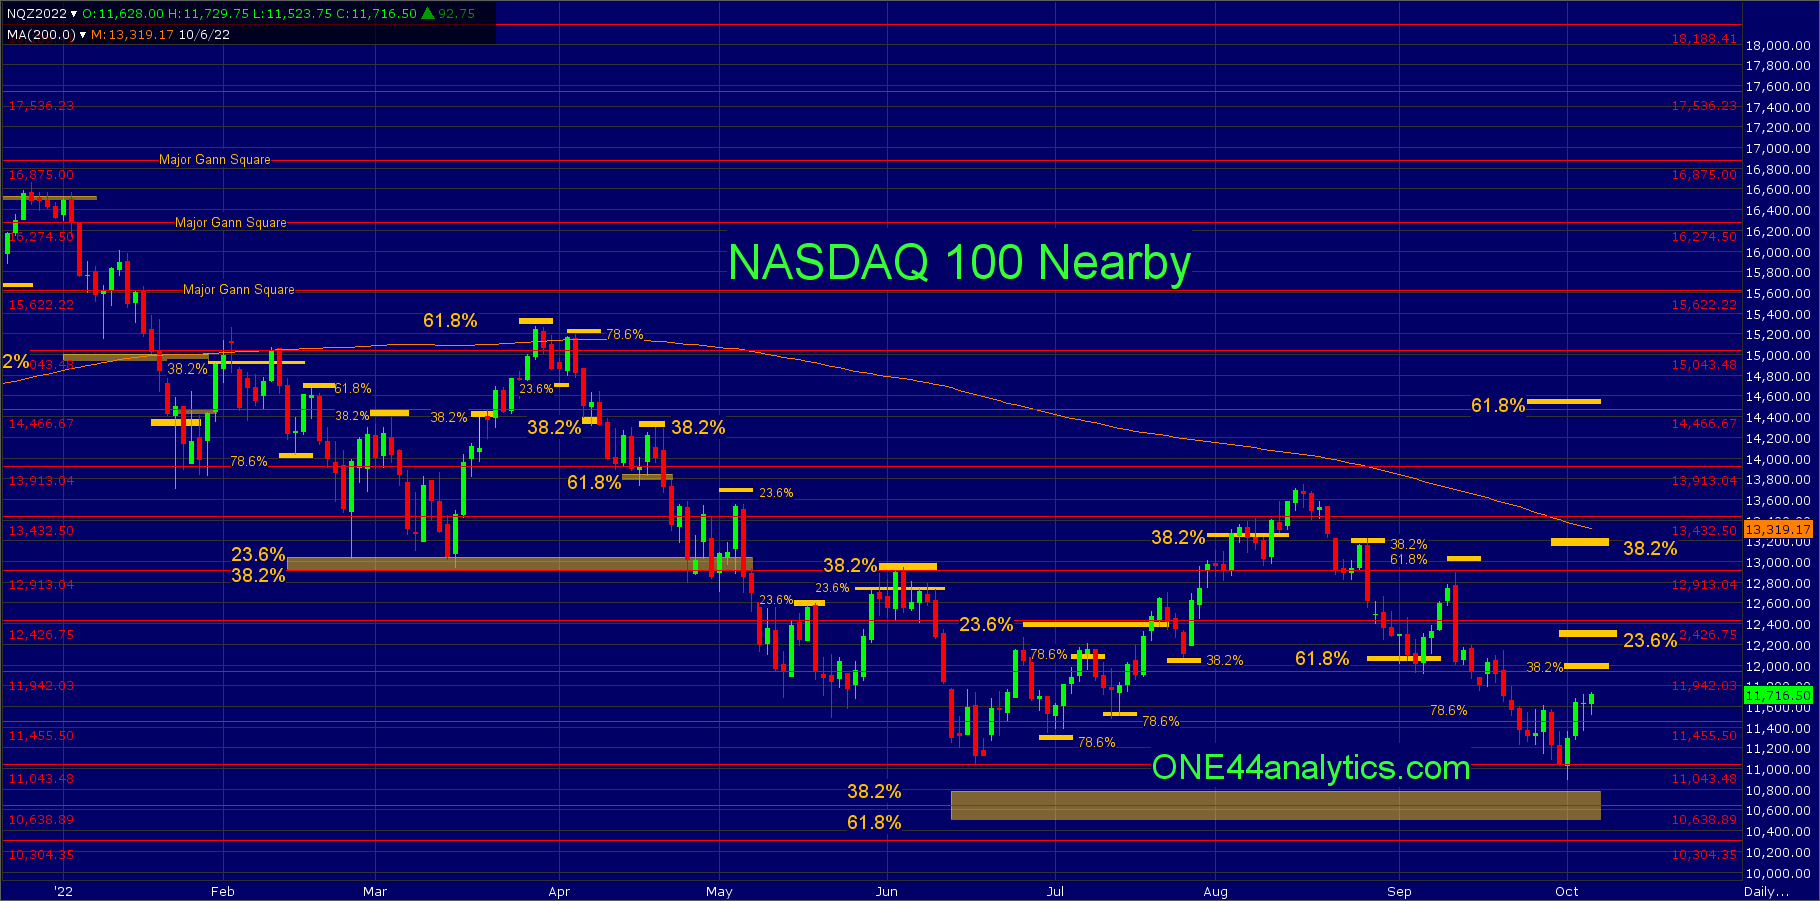
The low this week has held 61.8% of the 6/16/22 low and 8/16/22 high, this level is 12,050 and the 11,942 major Gann square. When we use the ONE44 61.8% rule,
Whenever the market holds 61.8% of a move, look for it to go 61.8% of where it just came from. This usually happens when a market is directionless, or in a consolidation period.
We get a target of 61.8% the other way at 13,000. This is the longer term target and as always we watch all the retracements on every move to see just how strong, or weak the market is, so ....
The high on 9/13/22 was 12,889, just short of the 12,913 major Gann square and the 13,000 target. We now get an upside target of 13,150 after taking out the 6/16/22 low for the following reasons.
To begin we will use another part of the last post,
On an extended break, look for the long term retracements of 10,800 to 10,500. This is 38.2% back to the 2009 low and 61.8% back to the 2020 low.
When it took out the 6/16/22 low, it made a slightly lower low and didn't get two closes below the 11,043 major Gann square, it also held above the top of the long term retracements of 10,800 to 10,500 range. The low was 10,890. Whenever a market makes a slightly lower low and gets right back above the previous low, it can cause a sharp rally the other way and with it staying above such a key long term level the rally can be even more impressive.
The long term target on a rally from here is 13,150, this is 38.2% back to the ATH and the 200 day average is currently just above at 13,318 and moving on a downward trajectory. As always we will watch all the retracements on every move to see how strong, or weak the market is regardless of the longer term target. The first test will be 11,942, this is a major Gann square and 38.2% back to the 8/16/22 high. A failure to get above this level can send it right back down to the low. The next most important level to watch is 12,270, this 23.6% back to the ATH. One thing to watch for at this level is, it trades above it and hits the 12,426 major Gann square and closes back below it, this can cause a sharp move back to the low.
When and if the long term levels below (10,800/10,500) get taken out we will update the downside target.
If you like this kind of analysis and trade the Grains, give us a look Grains Weekly update.
FULL RISK DISCLOSURE: Futures trading contains substantial risk and is not for every investor. An investor could potentially lose all or more than the initial investment. Commission Rule 4.41(b)(1)(I) hypothetical or simulated performance results have certain inherent limitations. Unlike an actual performance record, simulated results do not represent actual trading. Also, since the trades have not actually been executed, the results may have under- or over-compensated for the impact, if any, of certain market factors, such as lack of liquidity. Simulated trading programs in general are also subject to the fact that they are designed with the benefit of hindsight. No representation is being made that any account will or is likely to achieve profits or losses similar to those shown. Past performance is not necessarily indicative of future results.