Soybeans and Corn, the break from 78.6%
ONE44 Analytics where the analysis is concise and to the point
Our goal is to not only give you actionable information, but to help you understand why we think this is happening based on pure price analysis with Fibonacci retracements and Gann squares.
You can get all the rules and guidelines to the Fibonacci retracements on our website.
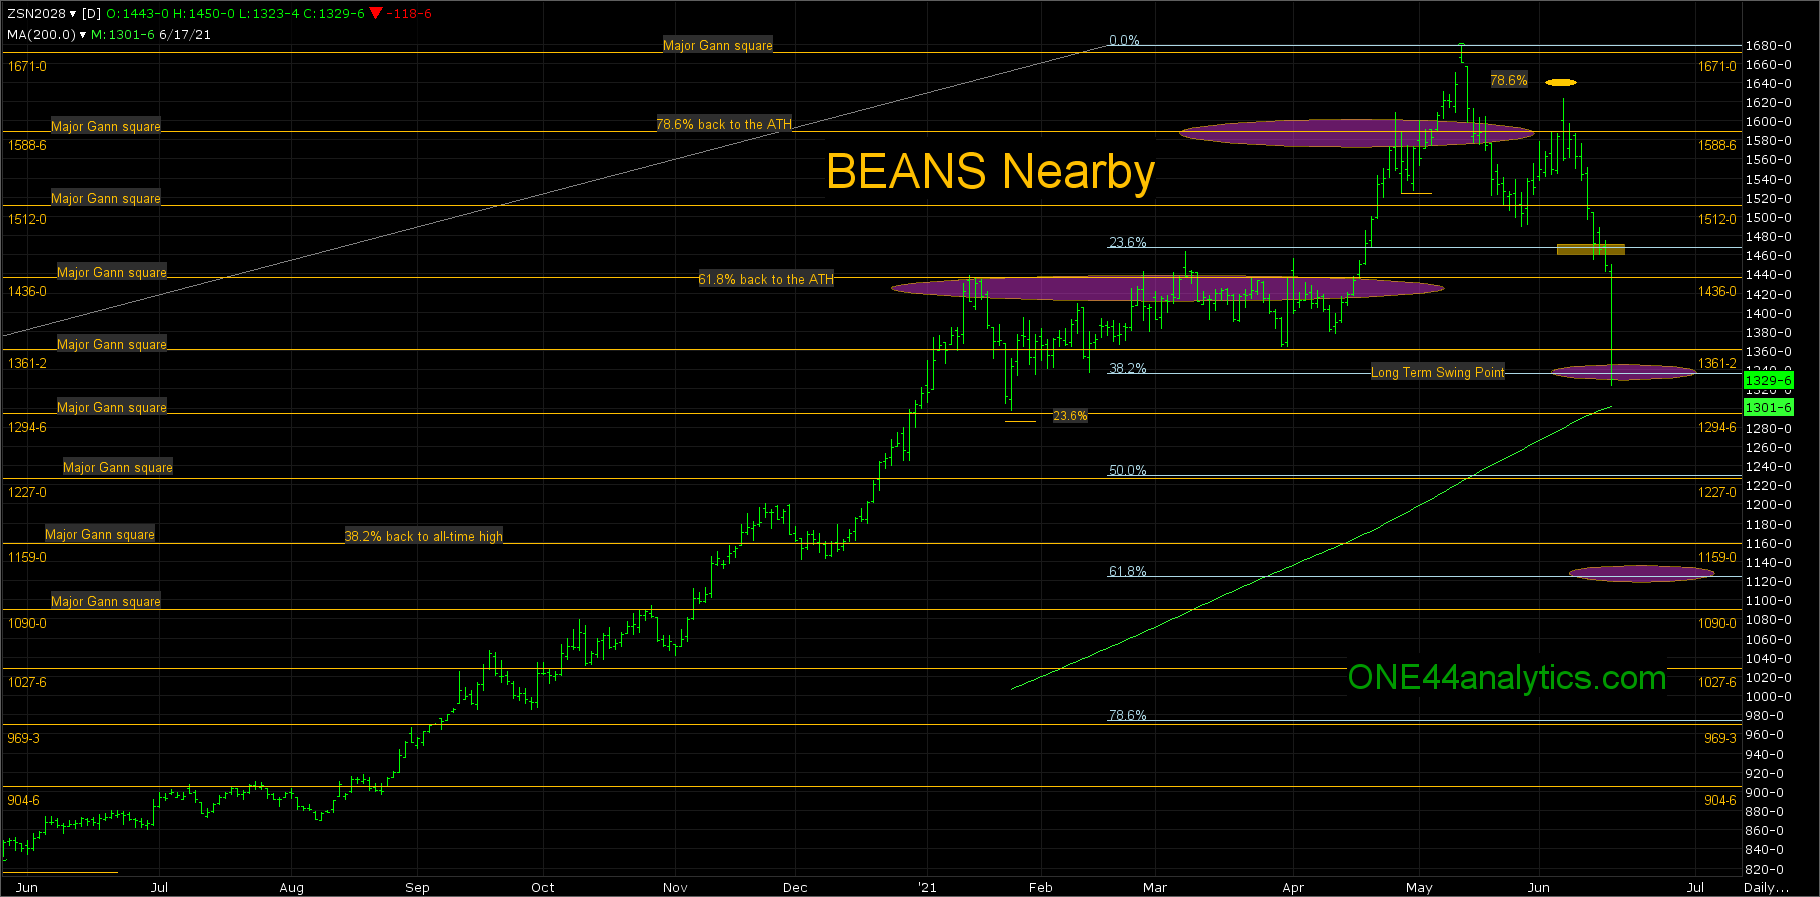
Soybeans
This is an update to the post "Soybean and Corn top" in it we told of the importance of the 78.6% retracements and how it is the level that a lot of bull runs end at.
Here we are four days later and the market has come off $1.70 so far from that post and $3.00 from the post on June 6th warning about 78.6% at 1640.00.. The close today was below the long term swing point on the Nearby chart at 1335.00. It was not a solid close through it, so tomorrow you will have to watch the 200 day average at 1302.00. Trading down to, or through it and then closing back above 1335.00 would be a positive sign and they should retest the highs again. As always we will watch all the retracements on any move back up to see just how strong, or weak the market is. With a solid close below 1335.00 (38.2%) and the 200 day average, the target becomes 61.8% based on the ONE44 Fibonacci rules and guidelines. This level is 1123.00.
Also watch...
The November Beans did not hit 38.2% yet, this is 1230.00. Tomorrow watch for a trade below it and then closing back above it, this would be a positive sign and just like the July contract a failure to hold 38.2% should send them down to 61.8% at 1075.00.
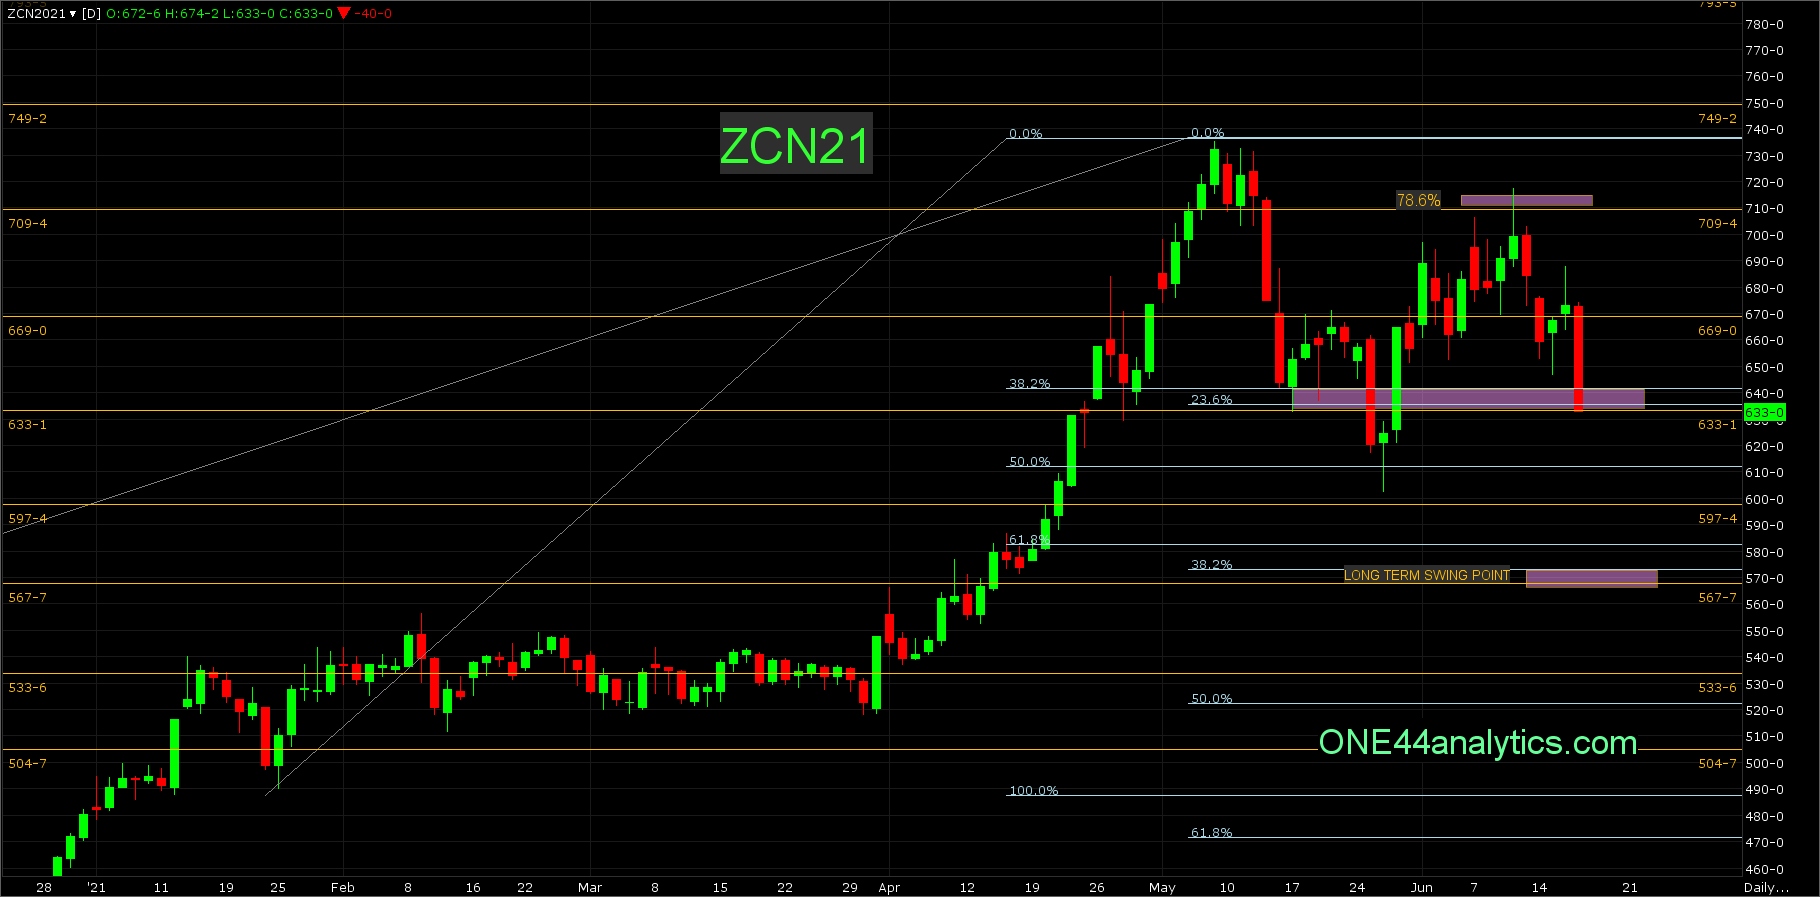
Corn
In those same updates mentioned above, we gave the 78.6% level of 709.50. It did trade above it on 6/10/21, but failed to close above it. Five trading days later it is 80 cents lower and right at 635.00 this is 23.6% back to the 2020 low. They did hit this level before at the end of May, so it is more likely to go to the long term swing point at 570.00, this is 38.2% back to the 2020 low. One thing to watch is, if they trade below the 633.00 major Gann square and then close back above 640.00, you can then look for a retest of the recent high. As always we will watch all the retracements on any move back up to see just how strong, or weak the market is.