Soybeans on the run update
ONE44 Analytics where the analysis is concise and to the point
Our goal is to not only give you actionable information, but to help you understand why we think this is happening based on pure price analysis with Fibonacci retracements, that we believe are the underlying structure of all markets and Gann squares.
For the ONE44 Fibonacci rules and guidelines to help with this article, go here.
This is our latest video in an ongoing series of how to use the Fibonacci retracements. Even if you do not trade the market covered, the ONE44 rules and guidelines are the same, as we believe the Fibonacci retracements are the underlying structure of all markets.
https://youtu.be/HEyLVbjvHDg
Charts are courtesy of Barchart.com
(ZSH22) (ZSK22) (ZSN22) (ZSX22)
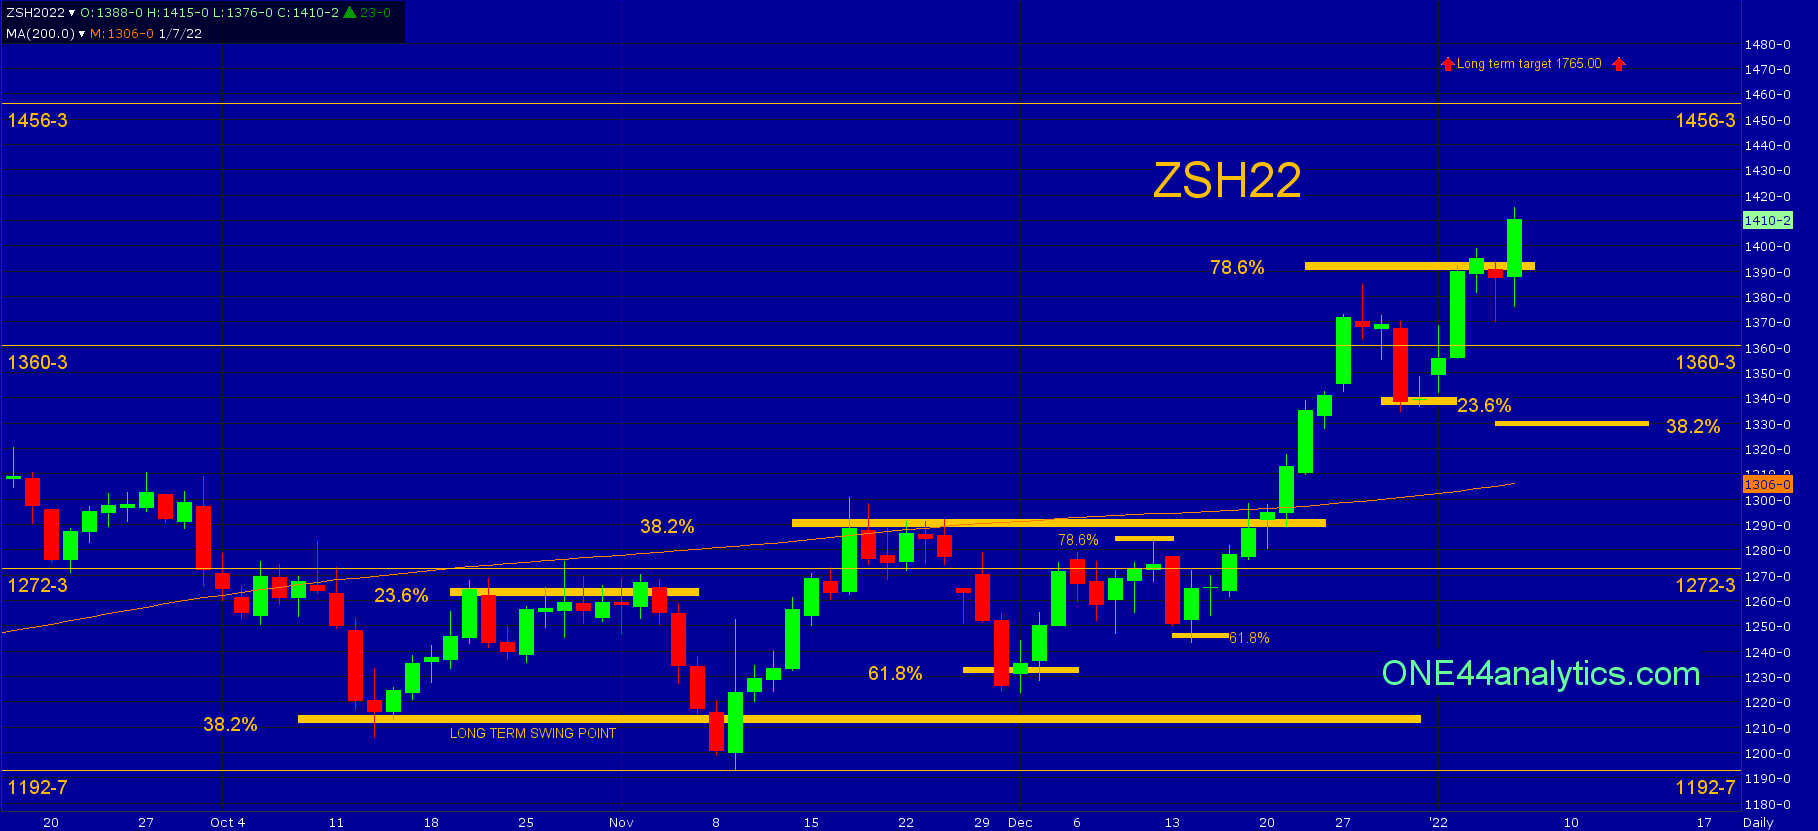
This is an update to "Soybeans on the run" on 12/26/21
As mentioned in that post, it had held the long term swing point and closed above the short term swing point of 1290.00. The levels to watch for resistance were 61.8% at 1350.00 and 78.6% at 1390.00. It is not surprising that both of these levels were taken out with the rally coming from the long term swing point of 1214.00. On 12/28/21 it came close to 78.6% at 1390.00 and the setback back from it could only go 23.6% of the current rally, this was 1339.00. This is why we say you have to watch all the retracements on every move to see just how weak, or strong the market is regardless of the long term targets. As the 23.6% rule states,
Extremely strong/weak markets will only go back 23.6%. This is Typically a runaway market.
The rally from 23.6% took it right through 1390.00. You can use 1390.00 as a swing point now. Above it, look for new contract highs and the major Gann square at 1456.00. Our long term target is still 1765.00. Right back below 1390.00 should send it to the short term swing point of 1331.00, this is 38.2% of the current rally.
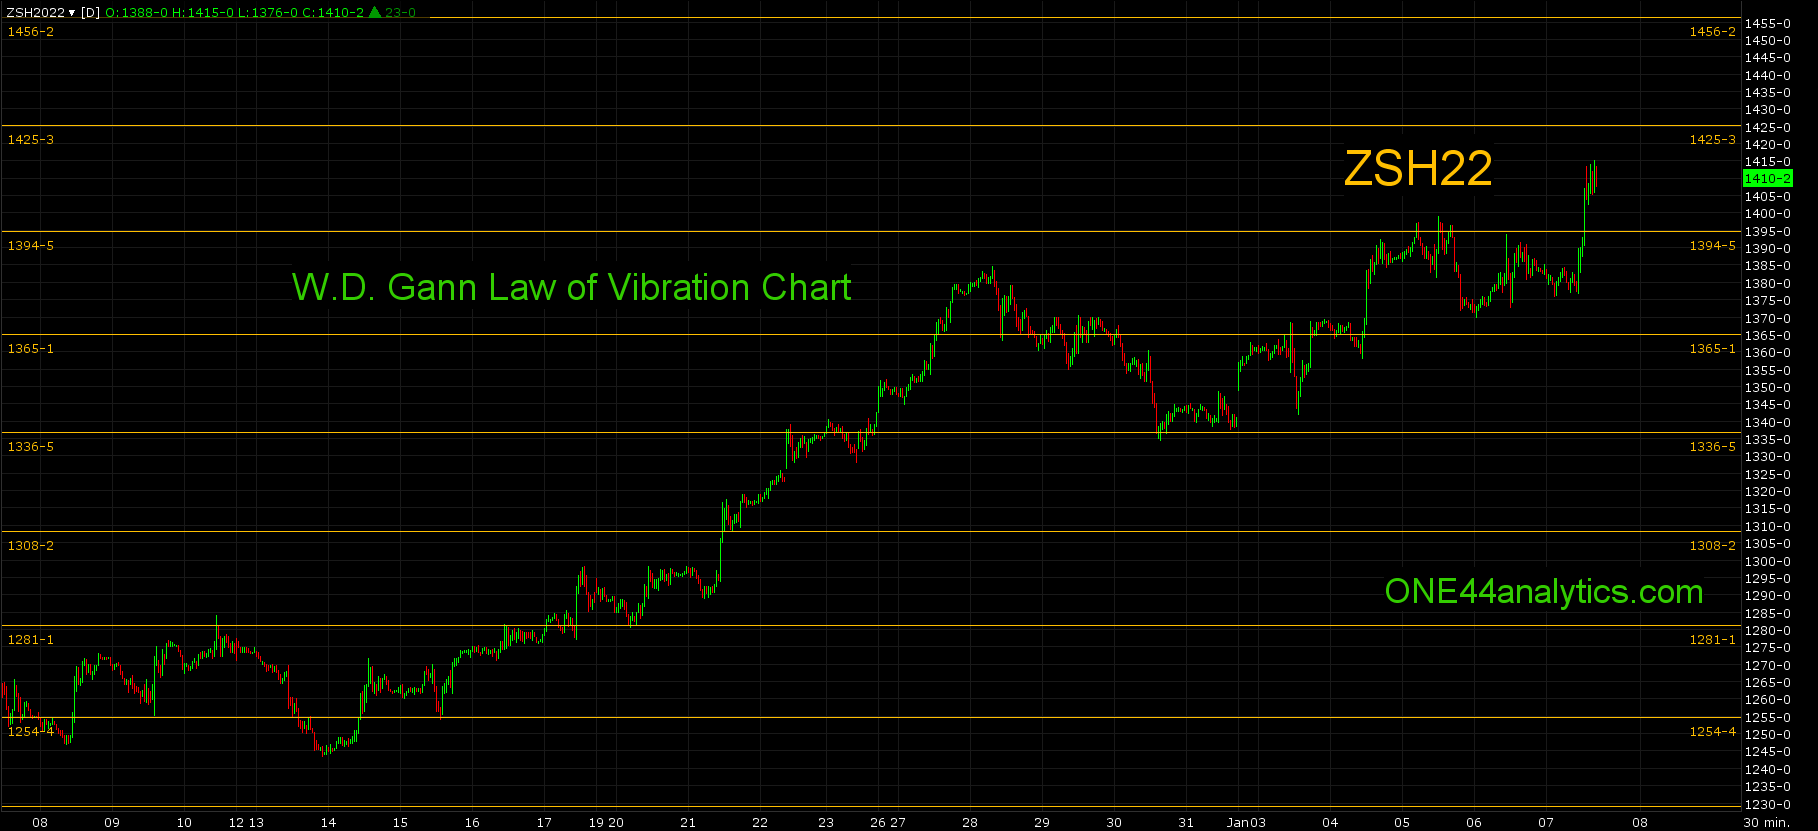
You can also use the Law of Vibrations charts posted on our website for short term support and resistance levels. (Chart below)
Sign up for our Free newsletter here.
FULL RISK DISCLOSURE: Futures trading contains substantial risk and is not for every investor. An investor could potentially lose all or more than the initial investment. Commission Rule 4.41(b)(1)(I) hypothetical or simulated performance results have certain inherent limitations. Unlike an actual performance record, simulated results do not represent actual trading. Also, since the trades have not actually been executed, the results may have under- or over-compensated for the impact, if any, of certain market factors, such as lack of liquidity. Simulated trading programs in general are also subject to the fact that they are designed with the benefit of hindsight. No representation is being made that any account will or is likely to achieve profits or losses similar to those shown. Past performance is not necessarily indicative of future results.