Tesla and Fibonacci
ONE44 Analytics where the analysis is concise and to the point
Our goal is to not only give you actionable information, but to help you understand why we think this is happening based on pure price analysis with Fibonacci retracements, that we believe are the underlying structure of all markets and Gann squares.
For the ONE44 Fibonacci rules and guidelines to help with this article, go here.
Charts are courtesy of Barchart.com
Tesla
We want to bring you up to date from the post on 12/7/21 called, teslas-wide-swings-hitting-key-fibonacci-retracements-on-both-sides
It had just hit 23.6% of the ATH and ATL at 950.00 on 12/6/21 and we said ...
"Yesterday it took out the 979.00 low and the new low was 950.50, just above the 948.00 that is 23.6% of the ATH and ATL. It now looks to be starting the quick move back to the ATH, however as we always mention, you have to watch all the retracements on any move to see just how strong, or weak the market is regardless of the long term target. The key retracement for any trend to continue is 38.2% as was evident back in March and in November so, if the 78.6% level hit up at 1188.00 is going to be the end of the current Bull run for now, it should not close above 1063.00 (38.2%). Provided they fail to get above this area look for new lows for the move and then the 61.8% at 812.00. With a solid close above 1063.00 look for 78.6% that is now at 1181.00. The long term target is still 1370.00 provided they stay above 948.00 on a closing basis."
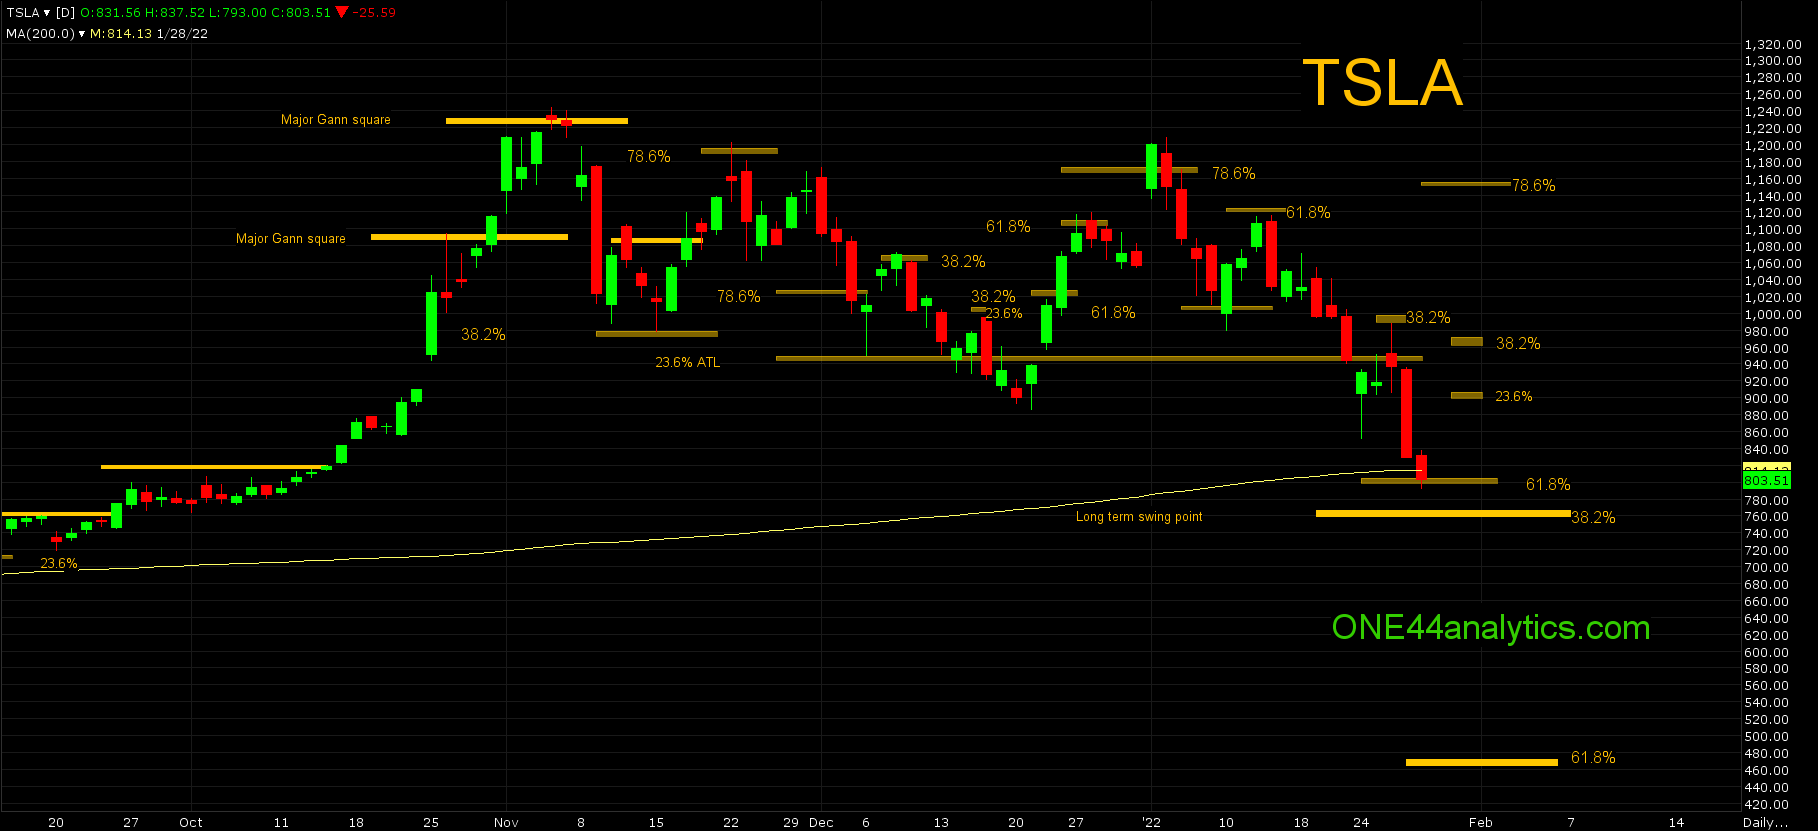
Going over this past statement, we would have been looking for new highs for the move after holding 950.50, however the next rally shows why it is so important to watch all the retracements on every move regardless of the longer term targets. The rally hit 1065.00, this was 38.2% back to the ATH and it collapsed from there. It did make a new low as you would be looking for following the ONE44 Fibonacci rules and took out the 950.50 low. The rally back above 950.50 fell just short of 23.6% at 1002.00 on 12/16/21 and that pushed to new lows again.
Here is a key thing to remember when dealing with major retracements like the ATH and ATL as 950.50 is, you can use it as a major swing point once taken out and the target when it gets back above/below it is the same as if it held perfectly. You do not want to do this with smaller moves.
With it back above 950.50 on 12/22/21 the target became new highs again. As you can see it blew through 38.2% at 1022.00 and stopped for a few days at 61.8% (1105.00), however the setback from that could only go 23.6% back of the rally keeping the trend very strong. The spike higher on 1/3/22 closed above 78.6% at 1171.50, following our rules you know we always want to see 2 closes above/below a level to violate it. The next day it closed right back below it and the target from a 78.6% level is 78.6% the other way and as the second part of the 78.6% rule states, " this is where a lot of Bull runs end and start". It did complete the 78.6% target, which was the 950.50 level, but before that there were a couple 61.8% retracements. The first was on 1/10/22 at 1005.00 and the 61.8% rule says to look for a 61.8% move the other way and they fell just short of 1120.00 on 1/13/22. The break from there took it to new lows for the move and back below 950.50 on 1/24/22. The pop back above 950.50 was stopped by 38.2% back to the ATH on 1/26/22 and a sharp move down followed to where we are today.
The target once 23.6% (950.50) is taken out, is to look for 38.2% of the same move. This is 767.00 and it is the long term swing point. In front of this is the 200 day average at 814.00 and 61.8% back to the 3/24/21 low at 806.00. With this being Tesla and wild swings are the norm, we would watch for a spike down to, or even below 767.00 and then a close back above the 200 day average, if this was to happen you may see the end of this slide. Provided this did happen the long term target is a new ATH, however as usual we will watch all the retracements on any rally to see just how strong, or weak the market is. Right now the levels to watch are 898.00 and 962.00. With a failure to hold 767.00 the next long term target becomes 61.8% at 471.00.
Sign up for our Free newsletter here
If you are looking for option plays to go with the ONE44 levels, we highly recommend going to the Barchart webinar library where John Rowland has plenty of information on Option strategies.
Here is one, Using the Long Strangle Options Strategy for Opportunity Trades
FULL RISK DISCLOSURE: Futures trading contains substantial risk and is not for every investor. An investor could potentially lose all or more than the initial investment. Commission Rule 4.41(b)(1)(I) hypothetical or simulated performance results have certain inherent limitations. Unlike an actual performance record, simulated results do not represent actual trading. Also, since the trades have not actually been executed, the results may have under- or over-compensated for the impact, if any, of certain market factors, such as lack of liquidity. Simulated trading programs in general are also subject to the fact that they are designed with the benefit of hindsight. No representation is being made that any account will or is likely to achieve profits or losses similar to those shown. Past performance is not necessarily indicative of future results.