Tesla, what a move, what a call

ONE44 Analytics where the analysis is concise and to the point
Our goal is to not only give you actionable information, but to help you understand why we think this is happening based on pure price analysis with Fibonacci retracements, that we believe are the underlying structure of all markets and Gann squares.
Tesla
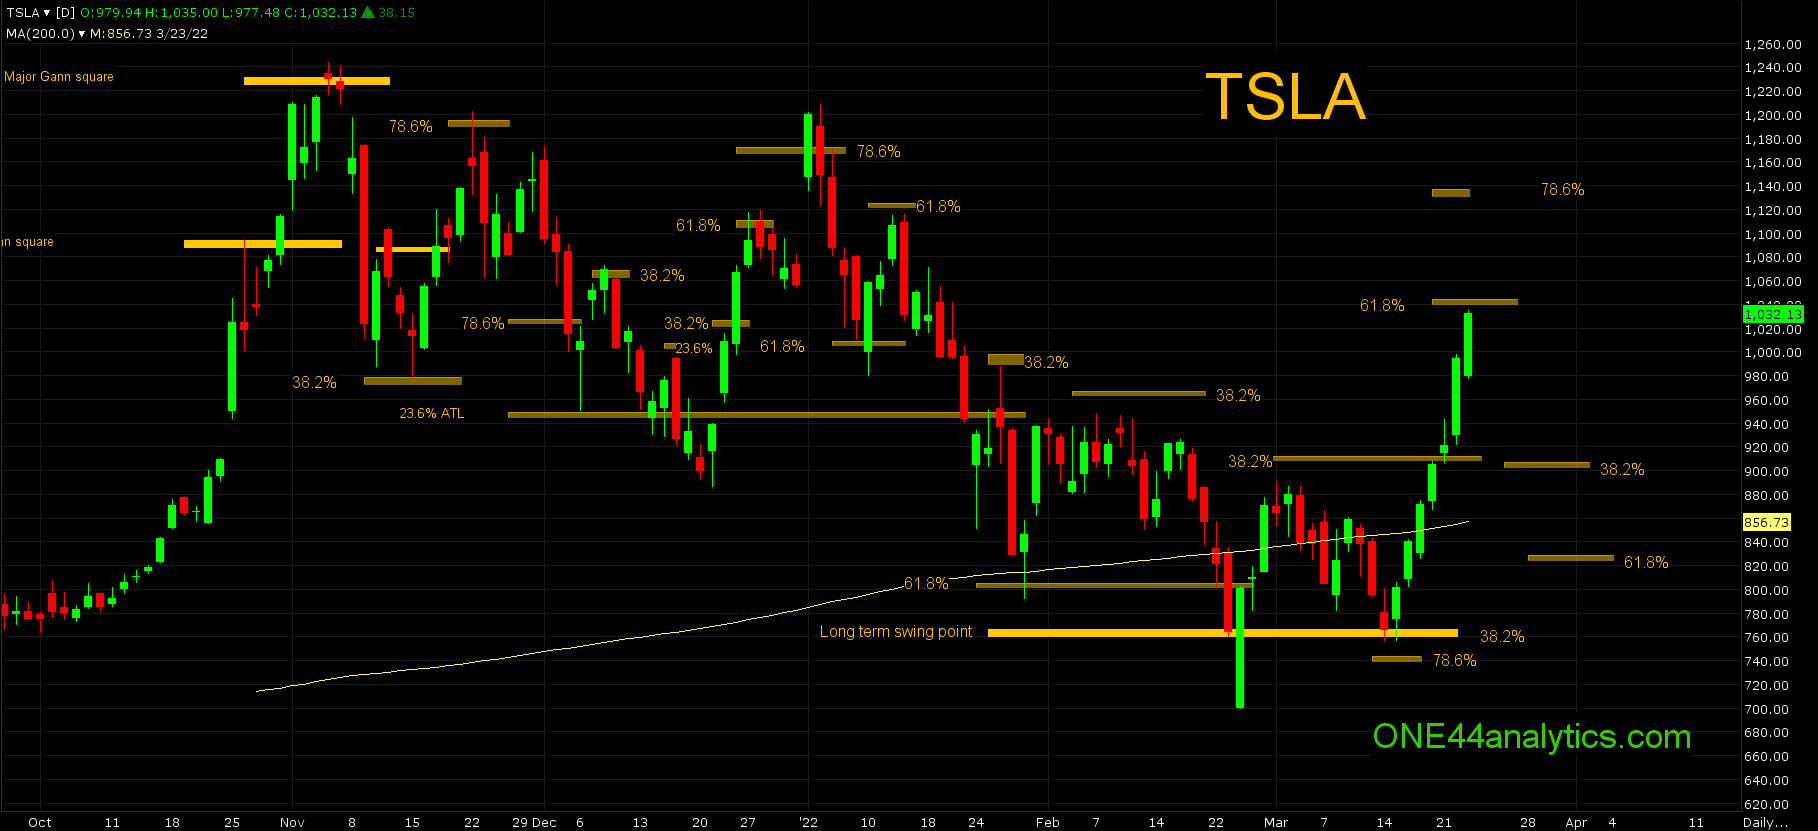
The call for Tesla to go from the long term swing point of 765.00 to 61.8% at 1040.00 is based on the ONE44 Fibonacci rules and guidelines.
All of this is from the 3/14/22 post,
The low on 2/24/22 traded well below the 765.00 long term swing point, however it never closed below it and a $130.00 rally followed. The top of that move fell short of 38.2% (909.00) back to the ATH on 3/1/22, keeping the short term trend negative. The break has now hit the long term swing point again and we are looking for another rally to begin.
Upside targets,
Being the long term swing point is 38.2% of the ATH and ATL, we know the long term target is new highs for the move. As always we will watch all the retracements on every move to see just how strong, or weak the market is regardless of the long term target.
Short term the next rally from 765.00 should take it to 61.8% at 1040.00 since the last high was just below 38.2%. We will still watch 38.2% at 909.00, because it is this level that needs to be taken out to get the short term positive and in sync with the long term trend.
As stated above, our goal is to have you understand why we think, what we think based on the ONE44 Fibonacci rules and guidelines.
So now what, first and foremost we know by holding the long term swing point, that new highs are the long term target, however they are currently at 61.8% (1040.00), so it's time to bring in the 61.8% rule,
Whenever the market holds 61.8% of a move, look for it to go 61.8% of where it just came from. This usually happens when a market is directionless, or in a consolidation period.
On a break from 61,8% look for 61.8% the other way, this is 829.00. As always we will watch all the retracements on every move to see just how weak, or strong the market is regardless of the longer term target. Any break that can only go 38.2% at 906.00 keeps this leg up in a positive position, any break from here that can only go 23.6% back at 960.00 keeps the trend extremely positive and you can look for new highs for this leg up and 78.6% back to the ATH at 1131.00, this will also be the next target, if there is no turn lower from 1040.00.
FULL RISK DISCLOSURE: Futures trading contains substantial risk and is not for every investor. An investor could potentially lose all or more than the initial investment. Commission Rule 4.41(b)(1)(I) hypothetical or simulated performance results have certain inherent limitations. Unlike an actual performance record, simulated results do not represent actual trading. Also, since the trades have not actually been executed, the results may have under- or over-compensated for the impact, if any, of certain market factors, such as lack of liquidity. Simulated trading programs in general are also subject to the fact that they are designed with the benefit of hindsight. No representation is being made that any account will or is likely to achieve profits or losses similar to those shown. Past performance is not necessarily indicative of future results.