The coming rally in Tesla
ONE44 Analytics where the analysis is concise and to the point
Our goal is to not only give you actionable information, but to help you understand why we think this is happening based on pure price analysis with Fibonacci retracements, that we believe are the underlying structure of all markets and Gann squares.
For the ONE44 Fibonacci rules and guidelines to help with this article, go here.
Charts are courtesy of Barchart.com
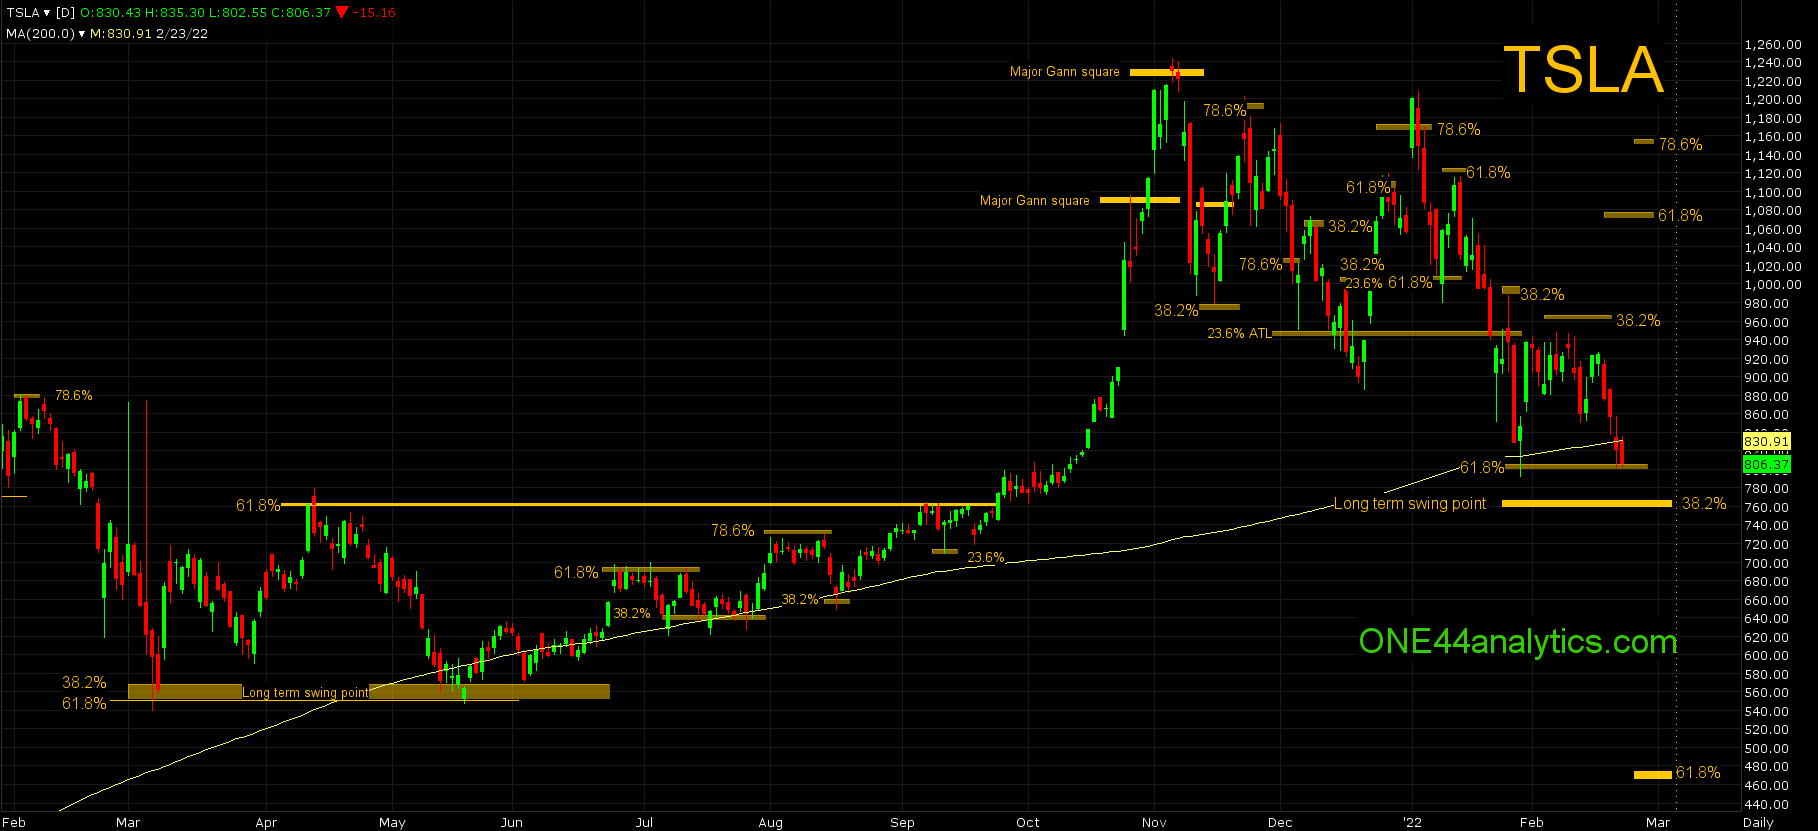
Tesla
This is an update to our last post on 1/28/22, Tesla and Fibonacci
Where we left you with this,
The target once 23.6% (950.50) is taken out, is to look for 38.2% of the same move. This is 767.00 and it is the long term swing point. In front of this is the 200 day average at 814.00 and 61.8% back to the 3/24/21 low at 806.00. With this being Tesla and wild swings are the norm, we would watch for a spike down to, or even below 767.00 and then a close back above the 200 day average, if this was to happen you may see the end of this slide. Provided this did happen the long term target is a new ATH, however as usual we will watch all the retracements on any rally to see just how strong, or weak the market is. Right now the levels to watch are 898.00 and 962.00. With a failure to hold 767.00 the next long term target becomes 61.8% at 471.00.
Today,
As you can see on the chart, the failure to make a new high on 1/4/22 at 78.6% is what turned this market lower. Each of the rallies after that hit smaller retracement showing more weakness, starting with 61.8% on 1/12/22 and then 38.2% on 1/26/22. The break from 38.2% took it to 61.8% (805.00) of the ATH and the 3/5/21 low. The 3/5/21 low held the long term swing point of 555.00 and then again in May sending it to the ATH.
On 1/28/22 it also traded below the 200 day average and closed back above it. The rally from it fell short of 38.2% on 2/7/22 and yesterday it hit 61.8% again.
Going forward,
With the long term swing point (765.00) being just below 61.8% (805.00) and a break from the 38.2% area (960.00) saying it should go for new lows. The best scenario for a move to the upside would be, it makes that new low, hits the long term swing point and then closes back above 805.00. Provided this did happen the long term target would be a new ATH, just as it was when they held the long term swing point back on 3/5/21. Short term, a rally from there should take it to 61.8% back up since the current break is reacting from the 38.2% area. With the current low this is 1070.00. As always we will watch all the retracements on any move higher to see just how strong, or weak the market is and 38.2% is always the most important.
A failure to hold the long term swing point should send this market to 61.8% at 471.00.
Sign up for our Free newsletter here.
If you are looking for option plays to go with the ONE44 levels, we highly recommend going to the Barchart webinar library where John Rowland has plenty of information on Option strategies.
Here is one, Using the Long Strangle Options Strategy for Opportunity Trades
FULL RISK DISCLOSURE: Futures trading contains substantial risk and is not for every investor. An investor could potentially lose all or more than the initial investment. Commission Rule 4.41(b)(1)(I) hypothetical or simulated performance results have certain inherent limitations. Unlike an actual performance record, simulated results do not represent actual trading. Also, since the trades have not actually been executed, the results may have under- or over-compensated for the impact, if any, of certain market factors, such as lack of liquidity. Simulated trading programs in general are also subject to the fact that they are designed with the benefit of hindsight. No representation is being made that any account will or is likely to achieve profits or losses similar to those shown. Past performance is not necessarily indicative of future results.