The Long and Short of Soybeans
ONE44 Analytics where the analysis is concise and to the point
Our goal is to not only give you actionable information, but to help you understand why we think this is happening based on pure price analysis with Fibonacci retracements, that we believe are the underlying structure of all markets and Gann squares.
For the ONE44 Fibonacci rules and guidelines to help with this article, go here.
Charts are courtesy of Barchart.com
Soybeans
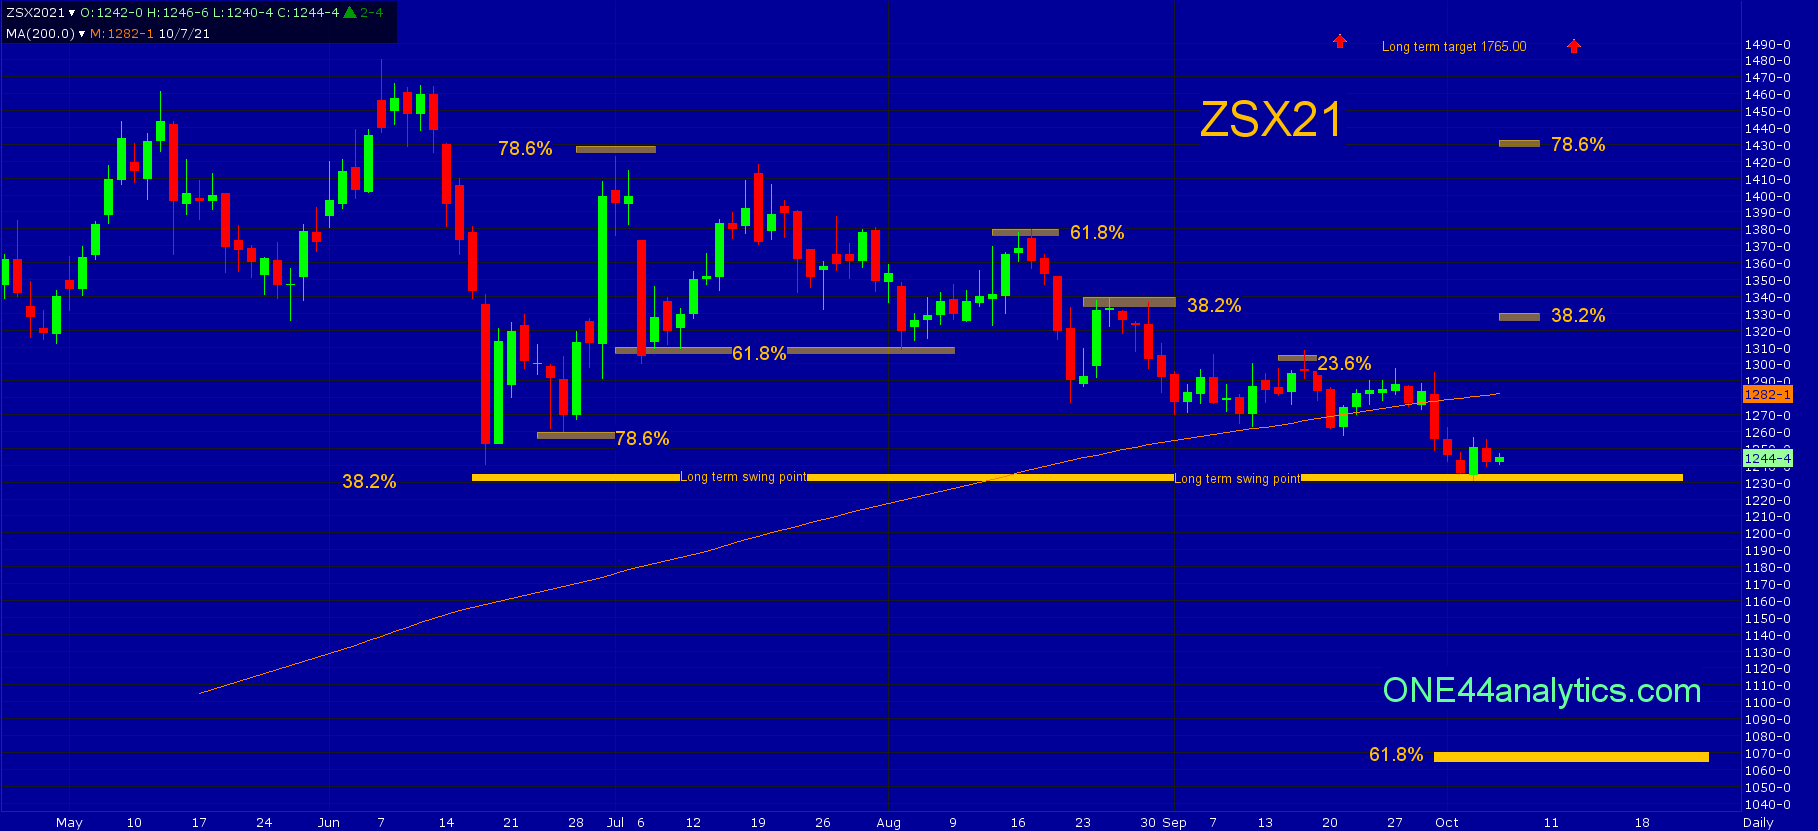
In Long term view Soybeans are holding the long term swing point of 1235.00, it did trade below it and as we previously mentioned this is acceptable as long as it does not have two closes below it. This is 38.2% of the contract high and the 2020 low. The target on a rally from here should send it to new highs for the year. We get this target by following the ONE44 Fibonacci 38.2% rule and as always we watch all the retracements on any move to see just how strong, or weak the market is regardless of the long term target. Failing to hold 1235.00 and closing below the 1222.00 Major Gann square should send it down to 61.8% on the Nearby chart at 1141.00 and then to 61.8% on the November contract at 1070.00. The next major Gann square below 1222.00 is 1156.00 and then 1091.50.
In the Short term view, the trend is still down, this started on 7/1/21 at the 78.6% retracement and as you can see on the chart, each rally has hit a retracement to keep it negative. This will be the case until it can take out 38.2% of the current down move at 1327.50. Once they have done this look for 78.6% at 1429.00, beyond this we look to the long term levels. Any rally from the 1235.00 area that does not get above 23.6% at 1290.00 keeps the short term trend very negative.
Check out our FREE Gann Law of Vibration Charts for short term support and resistance here.
Sign up for our Free newsletter here.
FULL RISK DISCLOSURE: Futures trading contains substantial risk and is not for every investor. An investor could potentially lose all or more than the initial investment. Commission Rule 4.41(b)(1)(I) hypothetical or simulated performance results have certain inherent limitations. Unlike an actual performance record, simulated results do not represent actual trading. Also, since the trades have not actually been executed, the results may have under- or over-compensated for the impact, if any, of certain market factors, such as lack of liquidity. Simulated trading programs in general are also subject to the fact that they are designed with the benefit of hindsight. No representation is being made that any account will or is likely to achieve profits or losses similar to those shown. Past performance is not necessarily indicative of future results.