Weekly Grain/Livestock Update 12/26/24

OVERVIEW
Corn is in the strongest position after failing to make a new low at a 78.6% retracement on 10/17/24 and then last week held a 38.2% retracement on 12/19/24. It has now taken out the long term retracements at 443.00.
Wheat remains in the weakest position, but holding above the 527.50 major Gann square, we continue to look for the first sign of a trend change based on the retracements.
Soybeans are getting close to the first test to see if they can turn the short term trend positive.
Live Cattle held above 38.2% this week and this can send it back to a new high, but as always we will watch the 78.6% retracement on any failure to make a new high. (ONE44 78.6% rule).
Lean Hogs held above the 83.52 major Gann square and swing point for the week, above it the short term target is still 78.6% back to the high.
ONE44 Analytics sends an email to every Premium Member when the Weekly update is done on Thursdays, if you do not receive one, please check your spam folder, or make sure you are signed up for the emails in your ONE44 account settings.
Being this is a weekly update we give all the key levels to watch for the week using Fibonacci retracements and Major Gann squares. We set up scenarios to look for when a level holds, or fails based on these methods, so it is very important to know for yourself how to use them following the ONE44 rules and guidelines. The best way to get a better understanding of these methods is to read all the posts (even if not on Grains) and watch our YouTube videos, as we explain why we think what we think based on the rules and guidelines. It is also important to view all the charts, as they have the key levels marked on them, if there are extended moves.
Thank You to all the new subscribers!
To all our Subscribers, when you are logged in to our website you will get all of the content in every post, so it may look like every Member/Non Member is getting the same thing. Please be assured that what you are paying for as a Premium Member of "Grains Weekly" is only accessible by you and is not posted anywhere else for free. This can be proven by logging out and trying to get the full article that has a yellow star with it. One exception is we will occasionally post articles on Barchart.com with excerpts from our website and Videos to draw people to the website.
Soybeans
| Trend | Swing Point | Target | |
|---|---|---|---|
| Long Term | 1068.00 | 940.00 | |
| Intermediate Term | 1045.00 | 940.00 | |
| Short Term | 1005.00 | 940.00 | |
| As of: 12/26/2024, 1:43:14 PM | |||
This will be the last update for January.
From last week,
This week's break took it down through the 965.50 major Gann square and failed to get right back above the 8/14/24 low to say a quick rally was possible, this level will be key for the next week. We will be retracing back to the 9/30/24 high, when it last hit 38.2% at 1076.00 and sent this market on a downward spiral.
Use 965.50 as the swing point for the week.
Above it, the short term target is 38.2% at 1000.00. The long term target area is 78.6% at 1057.00 and the 1061.75 major Gann square. Any rally that can't get above 23.6% at 978.00 keeps the trend extremely negative and a new low can quickly follow.
It held above the 965.50 major Gann square and today closed above 23.6% at 978.00 and this level will be key for the next week.
Use 978.00 as the swing point for the week.
Above it, continue to look for 38.2% back to the 9/30/24 high at 1000.00, provided this level is taken out the short term trend will turn positive. On an extended move higher look for 61.8% of the same range at 1033.00.
Below it, getting right back below 978.00 is a very negative sign and new lows can quickly follow. We will also watch 78.6% back to the low at 955.00, failing to make a new low in this area can be the beginning of the next run higher (ONE44 78.6% rule). The long term target is 78.6% on the weekly chart at 828.00. Before then there are major Gann squares at 913.75 and 861.00 to look for support and then use as the swing point when it is closed below.
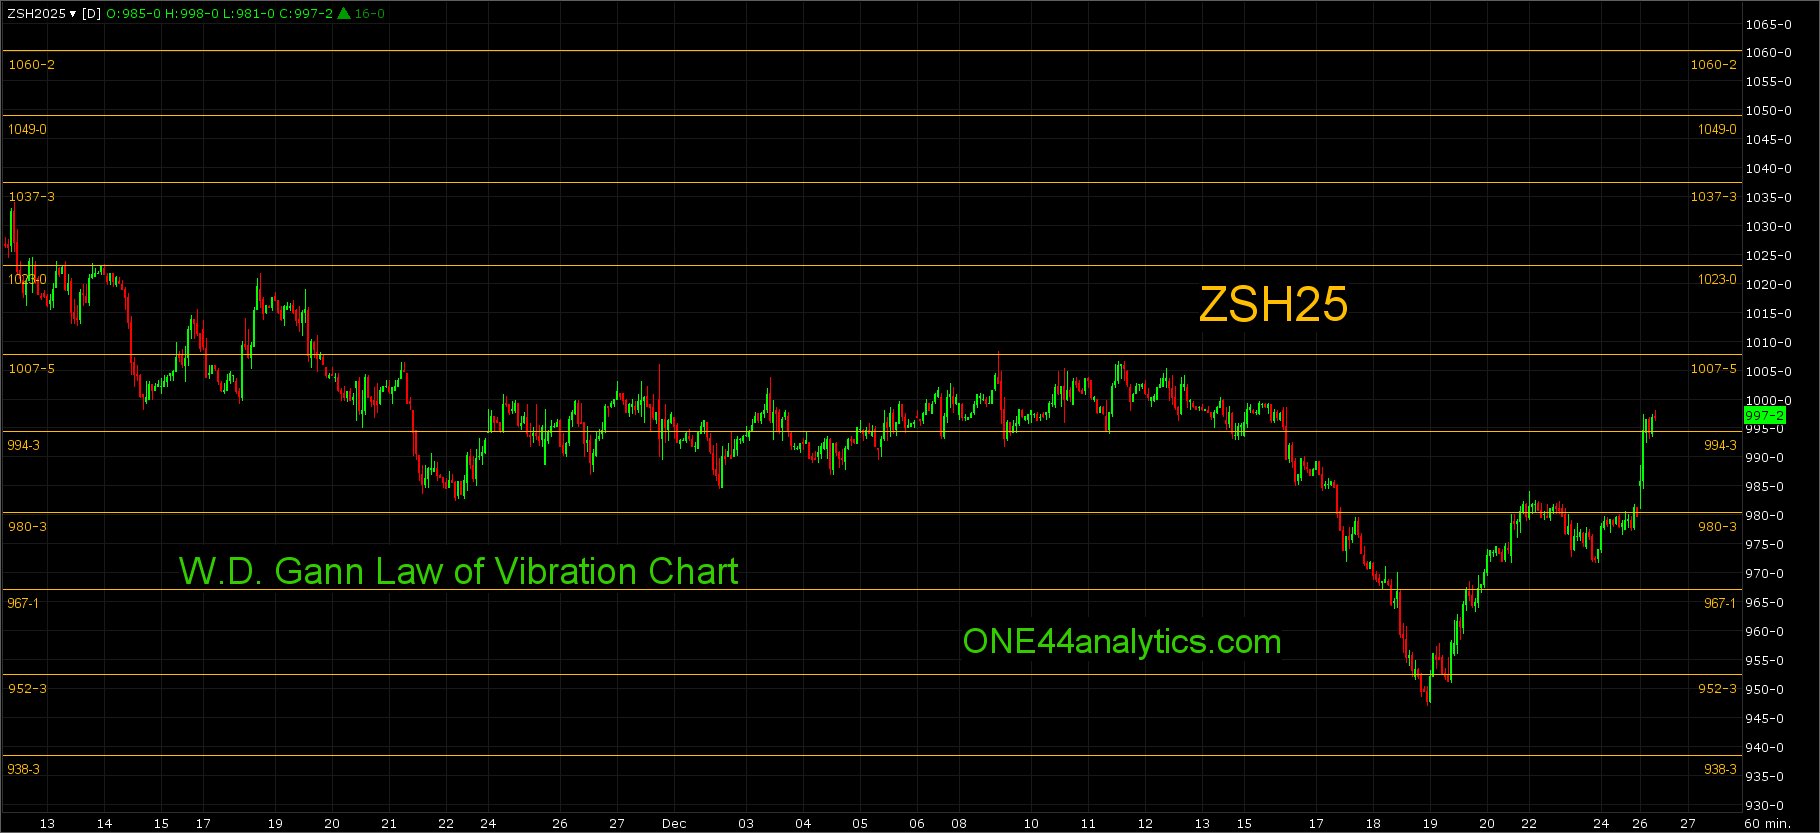
March
From last week,
There was no trade below the 981.00 major Gann square and close back above it to give us hope of a rally, however this level will again be key for the next week.
Use 981.00 as the swing point for the week.
Above it, the target area is the 1037.00 major Gann square and 61.8% back to the 9/30/24 high at 1042.00. Any rally that can't get above 38.2% of the same move at 1005.00 is a very negative sign and a new low can quickly follow.
Today's close is above the 981.00 major Gann square and we will be watching to see if it can take out 38.2% at 1005.00 to turn the short term trend positive. Without a new low all the Above/Below remain the same for this week.
Use 1005.00 as the swing point for the week.
Above it, the target area is the 1037.00 major Gann square and 61.8% back to the 9/30/24 high at 1042.00. Any rally that can't get above 38.2% of the same move at 1005.00 is a very negative sign and a new low can quickly follow.
Below it, there are only major Gann squares to look for support and then use as the swing point when closed below, the next two are 925.25. and 865.25.
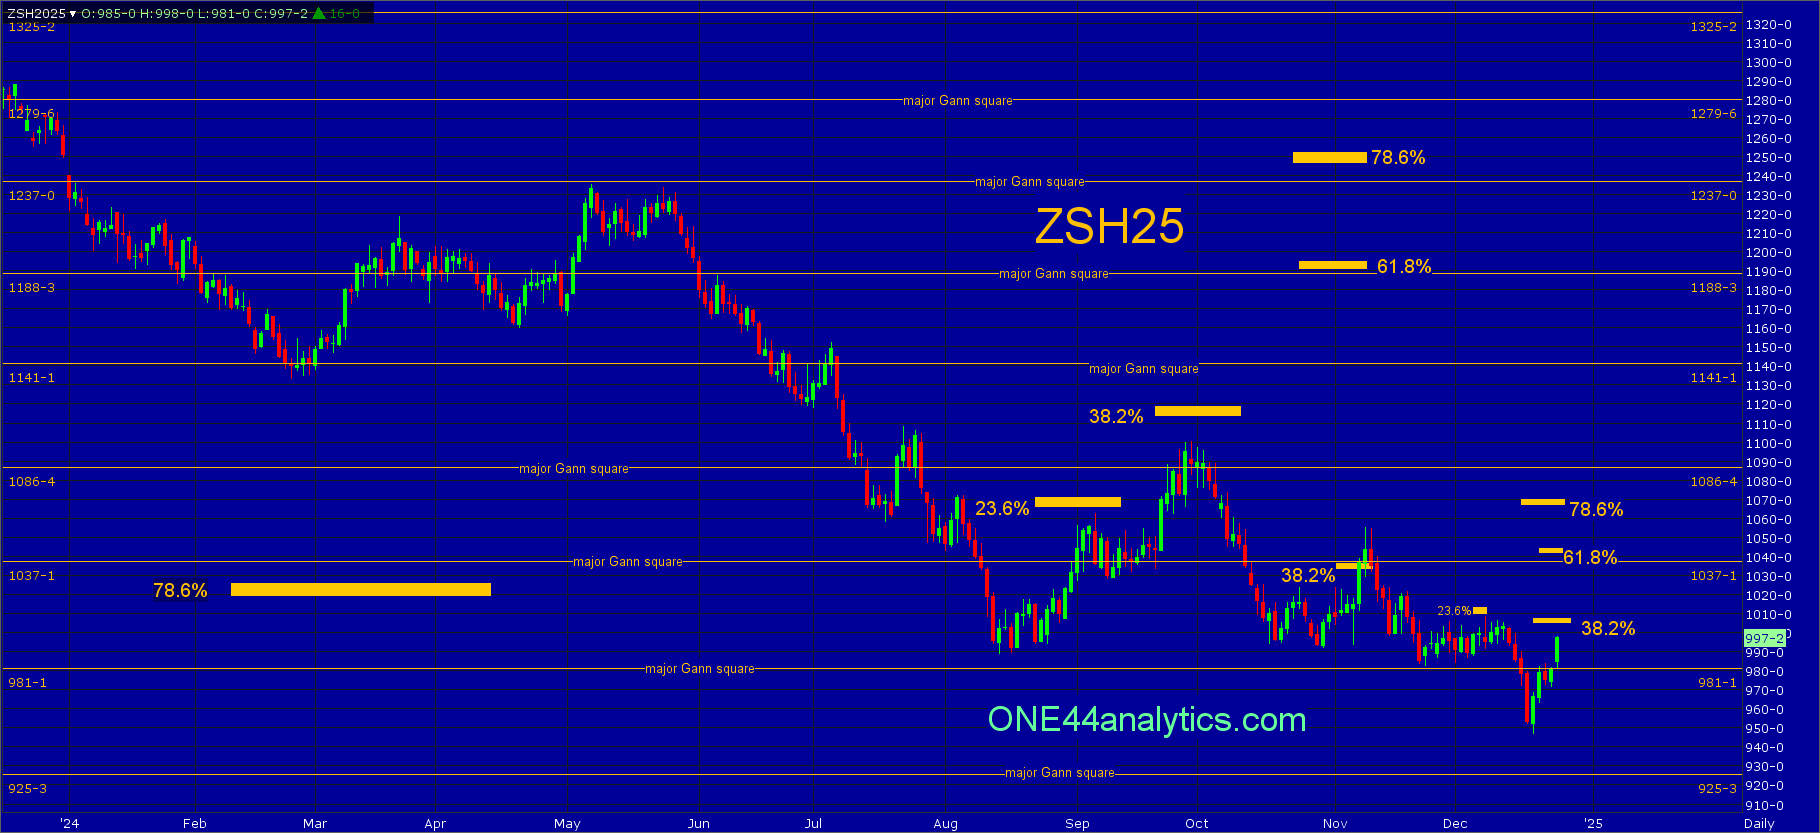
Law of Vibration chart for short term support and resistance
Soybean Meal
| Trend | Swing Point | Target | |
|---|---|---|---|
| Long Term | 335.00 | 255.00 | |
| Intermediate Term | 315.00 | 277.00 | |
| Short Term | 300.80 | 332.00 | |
| As of: 12/26/2024, 1:47:32 PM | |||
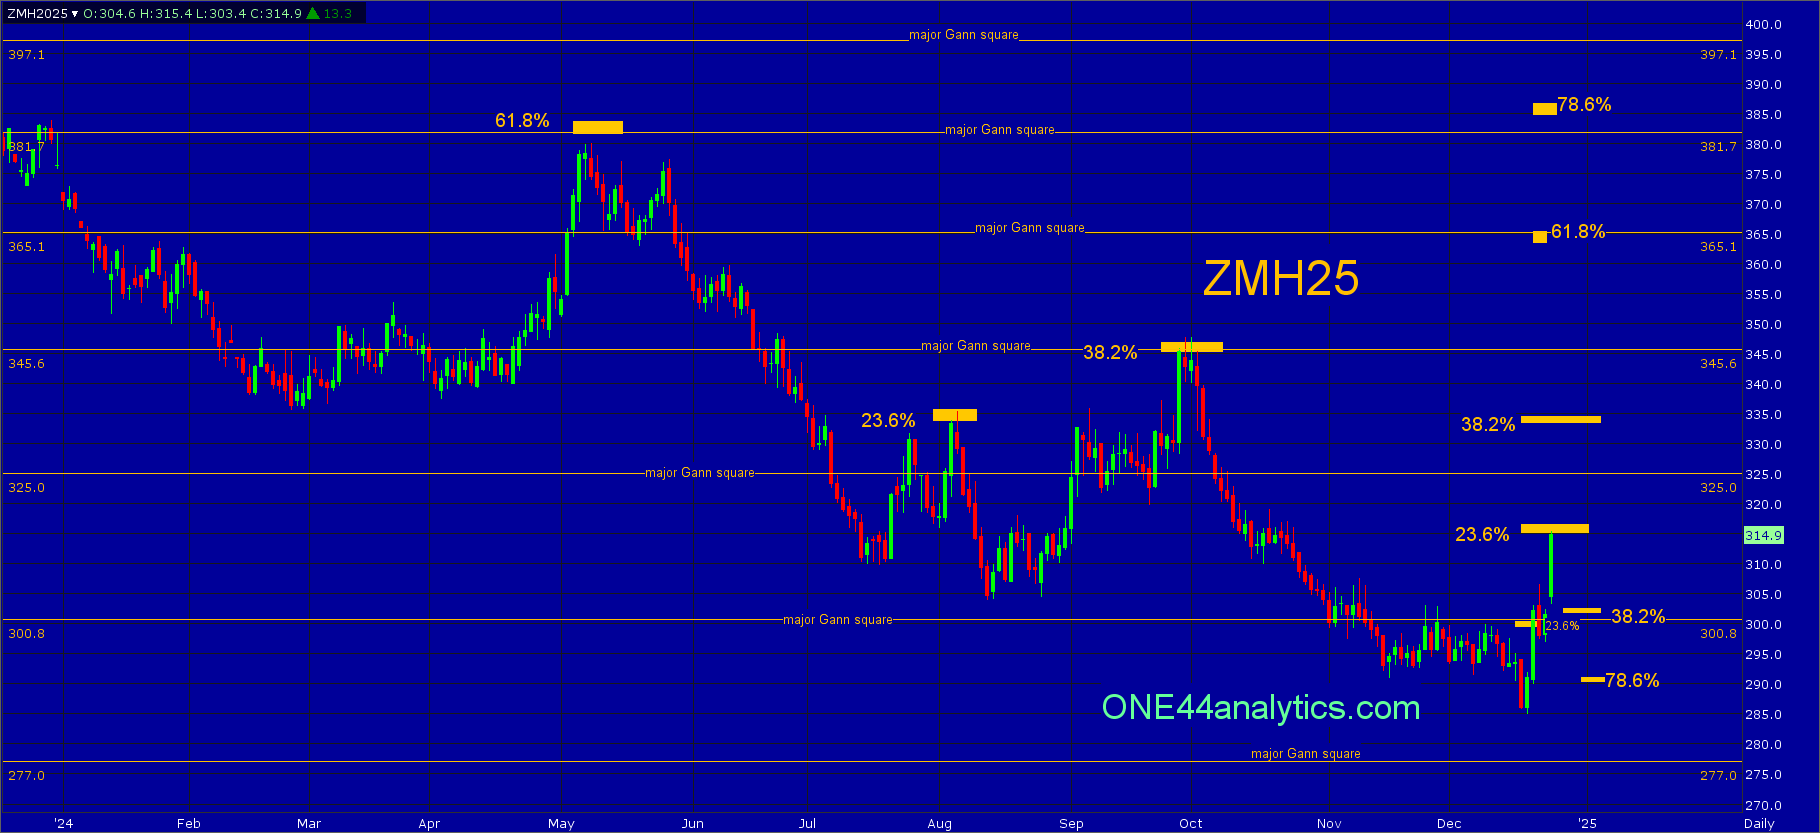
March
From last week,
All of this week traded below the 300.80 major Gann square and it did make a new low for the year, this will lower all of the levels above except for the swing point.
Use 300.80 as the swing point for the week again.
Above it, the short term target is 23.6% back to the contract high at 315.00. The long term target is also the long term swing point at 335.00, this is 38.2% back to the contract high.
The big rally this week took it through the 300.80 major Gann square and just short of 23.6% at 315.00, this level will be key for the next week.
Use 315.00 as the swing point for the week.
Above it, look for the long term swing point at 335.00, this is 38.2% back to the contract high. On an extended move higher look for 61.8% of the same range at 365.10, this is also a major Gann square.
Below it, look for 78.6% back to the 12/19/24 low at 291.00. Any setback that holds 38.2% of the same range is a very strong sign and a new high for the current leg can quickly follow.
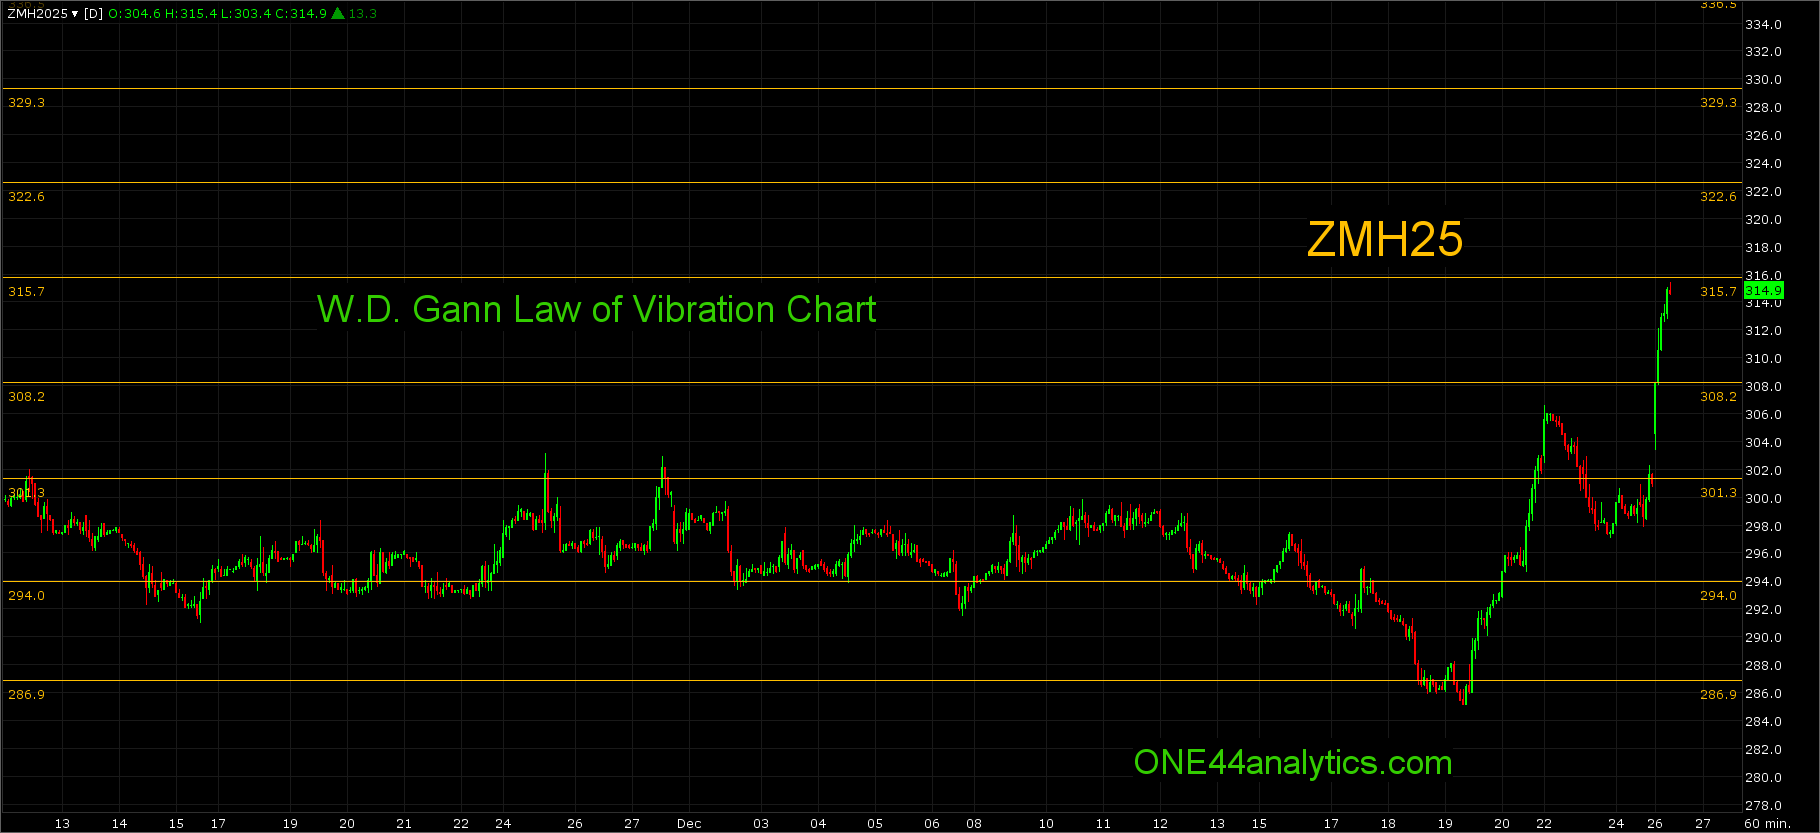
Law of Vibration chart for short term support and resistance
Soybean Oil
| Trend | Swing Point | Target | |
|---|---|---|---|
| Long Term | 50.50 | 39.40 | |
| Intermediate Term | 46.50 | 39.52 | |
| Short Term | 43.50 | 39.52 | |
| As of: 12/26/2024, 1:50:00 PM | |||
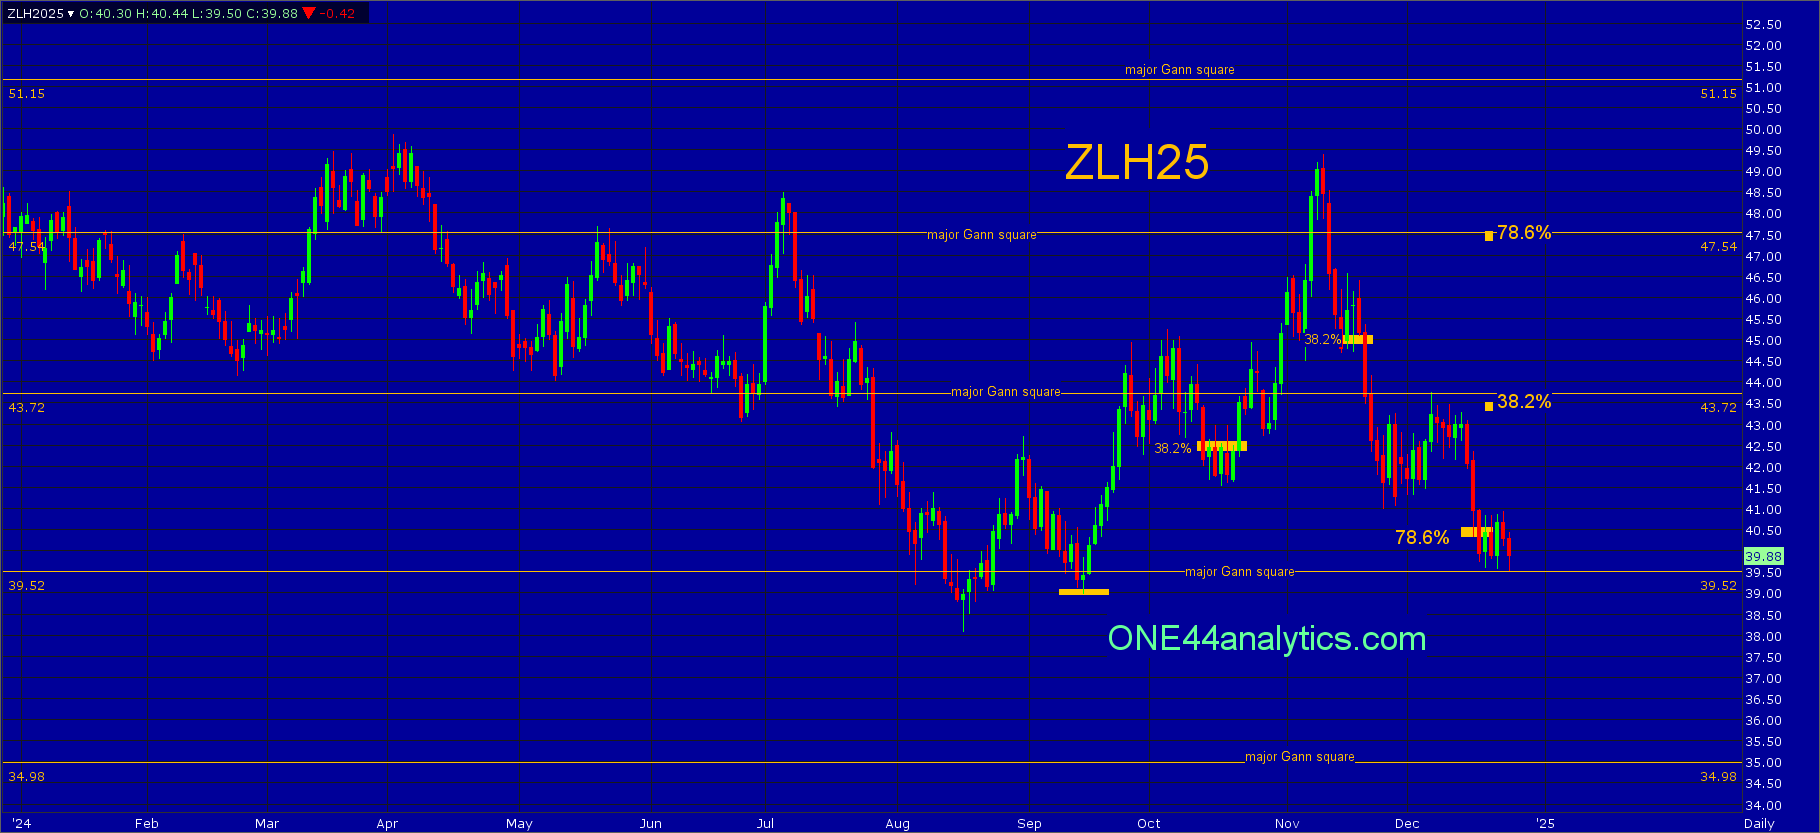
March
From last week,
The week's high was 43.27 and the break from it has one close below 40.50. Today's low was just above the 39.52 major Gann square and this l;evel will be key for the next week. Getting right back above 40.50 can cause a quick rally.
Use 39.52 as the swing point for the week.
All of this week held above the 39.52 major Gann square in a very small range, this level will again be key for the next week. All of the Above/Below remain the same for this week.
Use 39.52 as the swing point for the week.
Above it, the short term target area is 38.2% back to the 11/11/24 high at 43.30 and the 43.72 major Gann square. The long term target is 78.6% of the same move at 47.54, this is also a major Gann square.
Below it, A failure to turn up from this area will give us only major Gann square to look for support and then use as the swing point when closed below, the next one is 34.98.
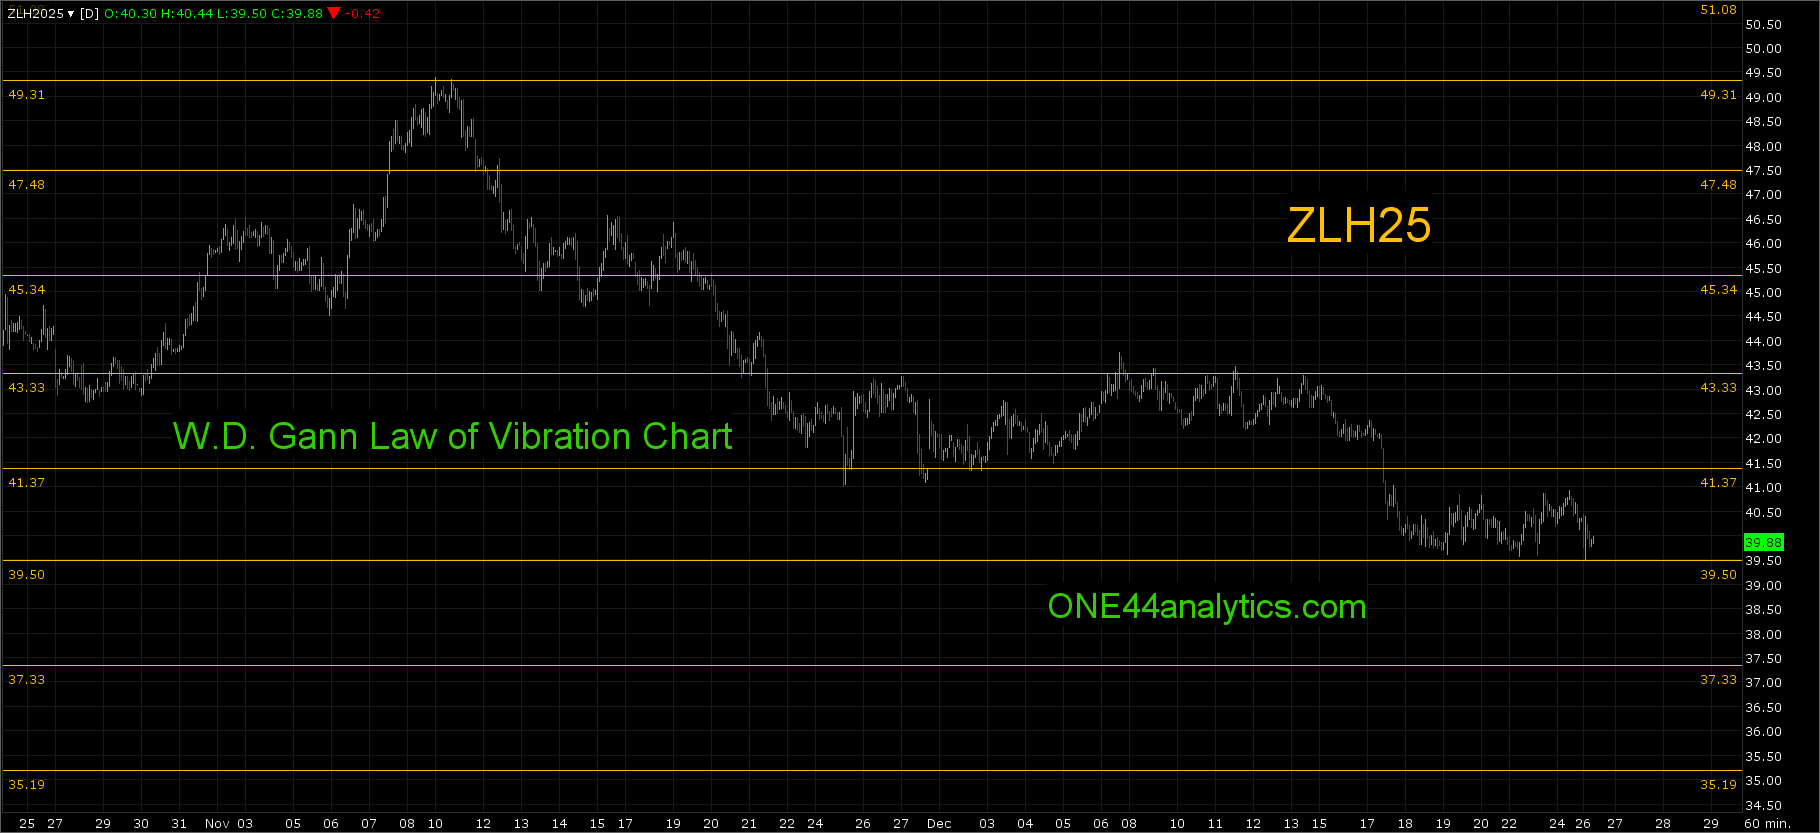
Law of Vibration chart for short term support and resistance
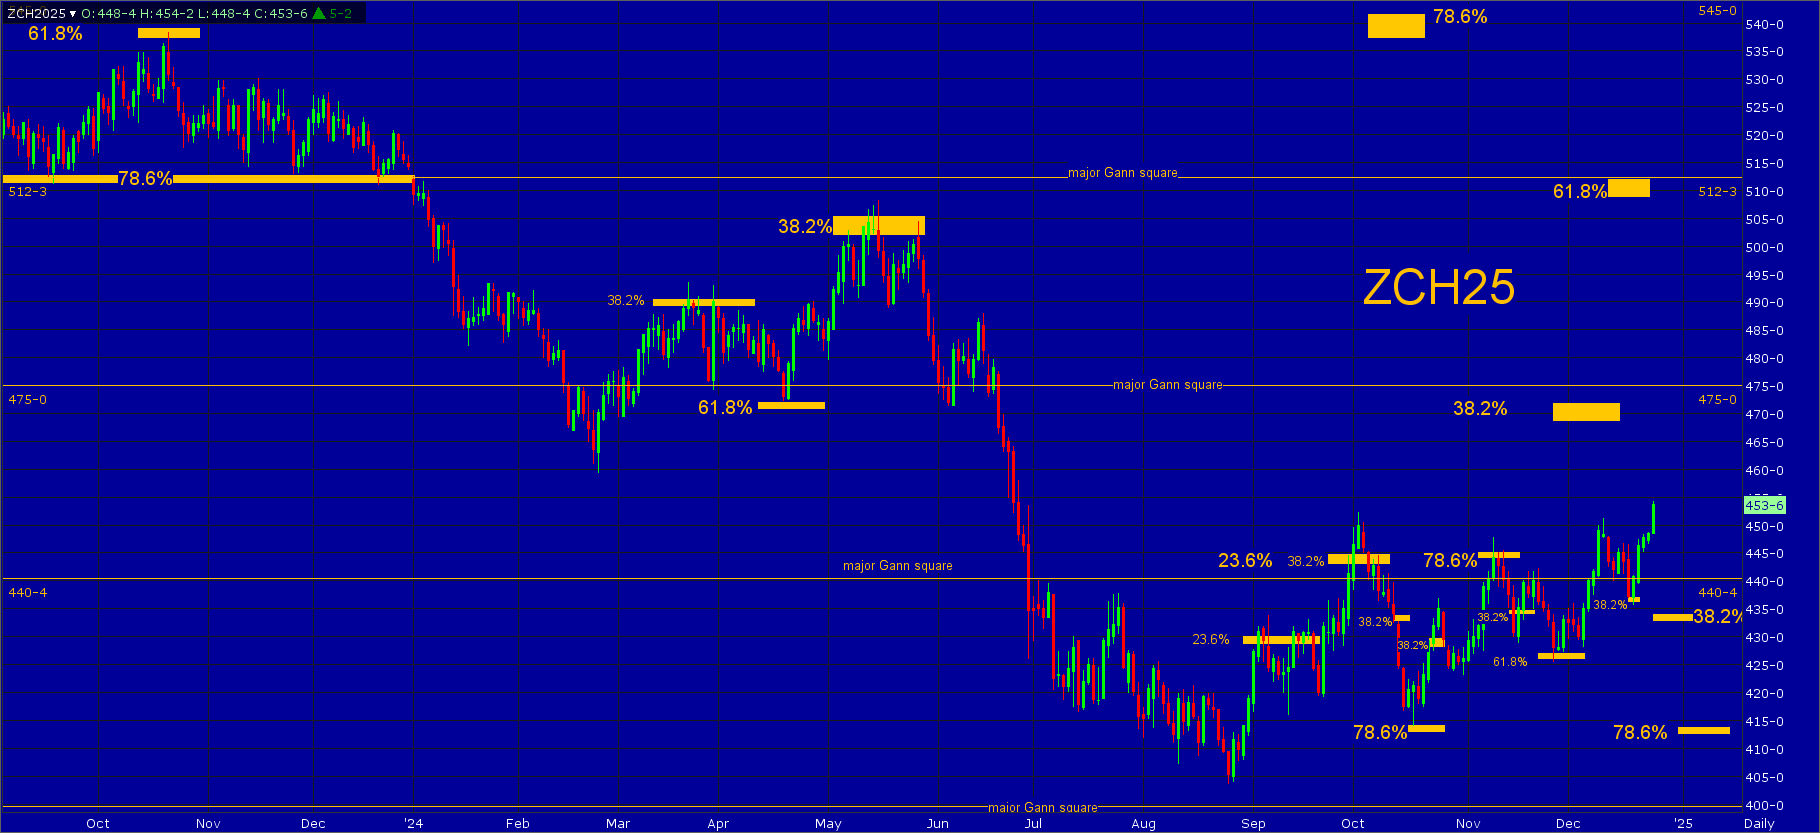
Corn
| Trend | Swing Point | Target | |
|---|---|---|---|
| Long Term | 472.00 | 414.00 | |
| Intermediate Term | 443.00 | 510.00 | |
| Short Term | 434.00 | 470.00 | |
| As of: 12/26/2024, 1:53:33 PM | |||
March
From last week,
It had only one solid close above 443.00 and the setback from there held the tight support of 437.00, this is 38.2% and a positive sign, so it will be the key level for the next week.
Use 437.00 as the swing point for the week.
After holding 38.2% the previous week, it has now gone on to a new high (ONE44 38.2% rule), it also has four closes above the long term retracements at 443.00. With the new high we will be retracing back to the 8/26/24 low and 23.6% of that range will be key for the next week.
Use 441.00 as the swing point for the week.
Above it, is extremely positive and the short term target is 469.00, this is 38.2% back to the contract high and the long term swing point. The long term target area is 61.8% back to the same high at 508.00 and the 512.25 major Gann square.
Below it, it will still need to take out the new 38.2% level at 434.00 to turn the current trend negative. On an extended move lower from here, look for 78.6% of the same range at 414.00. A failure to turn higher from this area will give us only major Gann squares to look for support and then use as the swing point when closed below, the next one is 399.50.
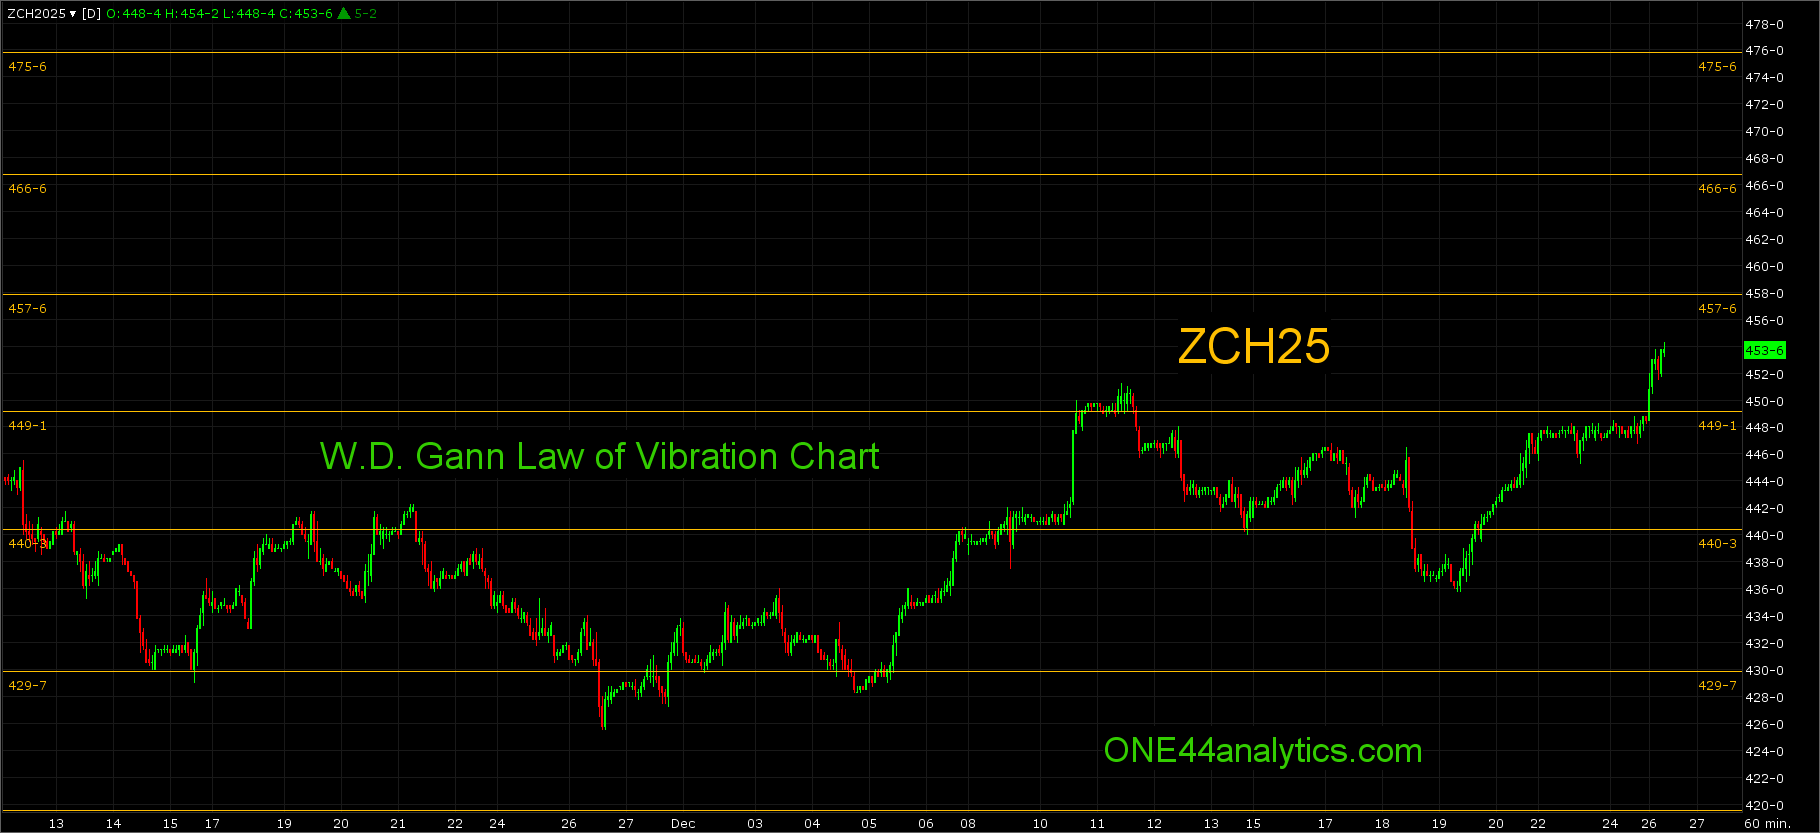
Law of Vibration chart for short term support and resistance
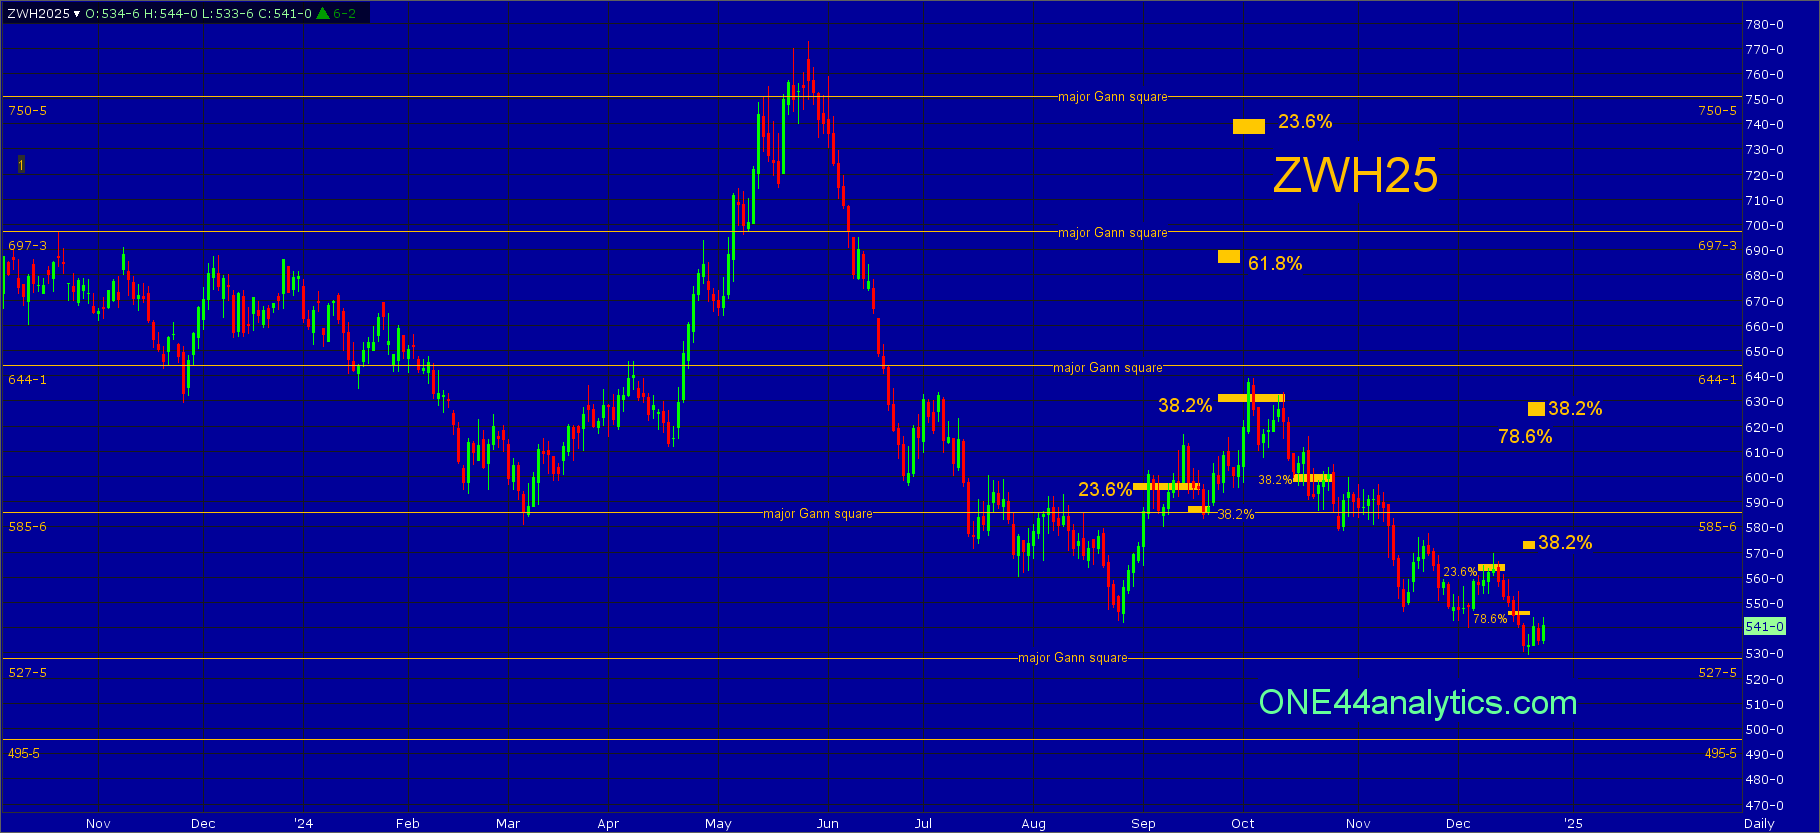
Wheat
| Trend | Swing Point | Target | |
|---|---|---|---|
| Long Term | 670.00 | 464.50 | |
| Intermediate Term | 610.00 | 495.50 | |
| Short Term | 570.00 | 495.50 | |
| As of: 12/26/2024, 1:56:39 PM | |||
March
From last week,
The high for the week was 561.00 and the 78.6% level at 546.00 failed to hold, taking away the one positive thing that could have happened and it went on to a new low for the year. It is just short of the 527.50 major Gann square and this will be the key level for the next week.
Use 527.50 as the swing point for the week.
It held above the 527.50 major Gann square, but the rally from that area is very muted so far, this level will again be key for the next week. All of the Above/Below are the same as last week.
Use 527.50 as the swing point for the week again.
Above it, the first test to see if the short term trend can turn positive is 38.2% back to the 10/2/24 high at 572.00, a failure to get above there can send it right back to the low. The long term target area on a rally from here is 78.6% back to the 10/2/24 high at 616.00 and 38.2% back to the 5/28/24 high at 625.00.
Below it, there are only major Gann squares to look for support and then use as the swing point when closed below, the next two are 494.50 and 464.25.
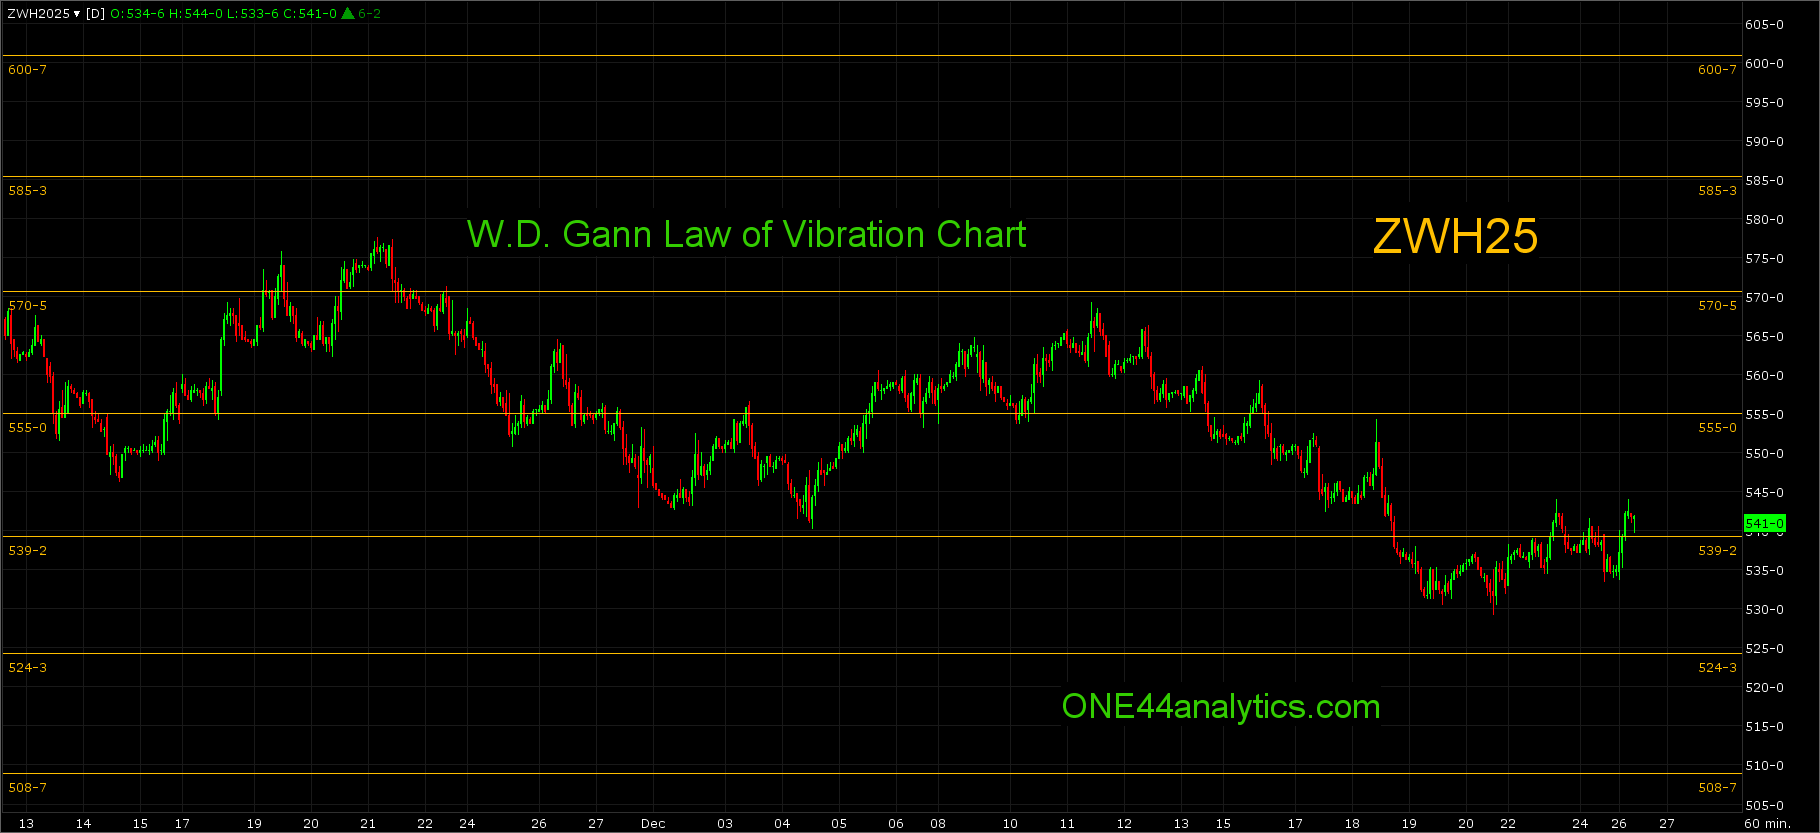
Law of Vibration chart for short term support and resistance
Livestock
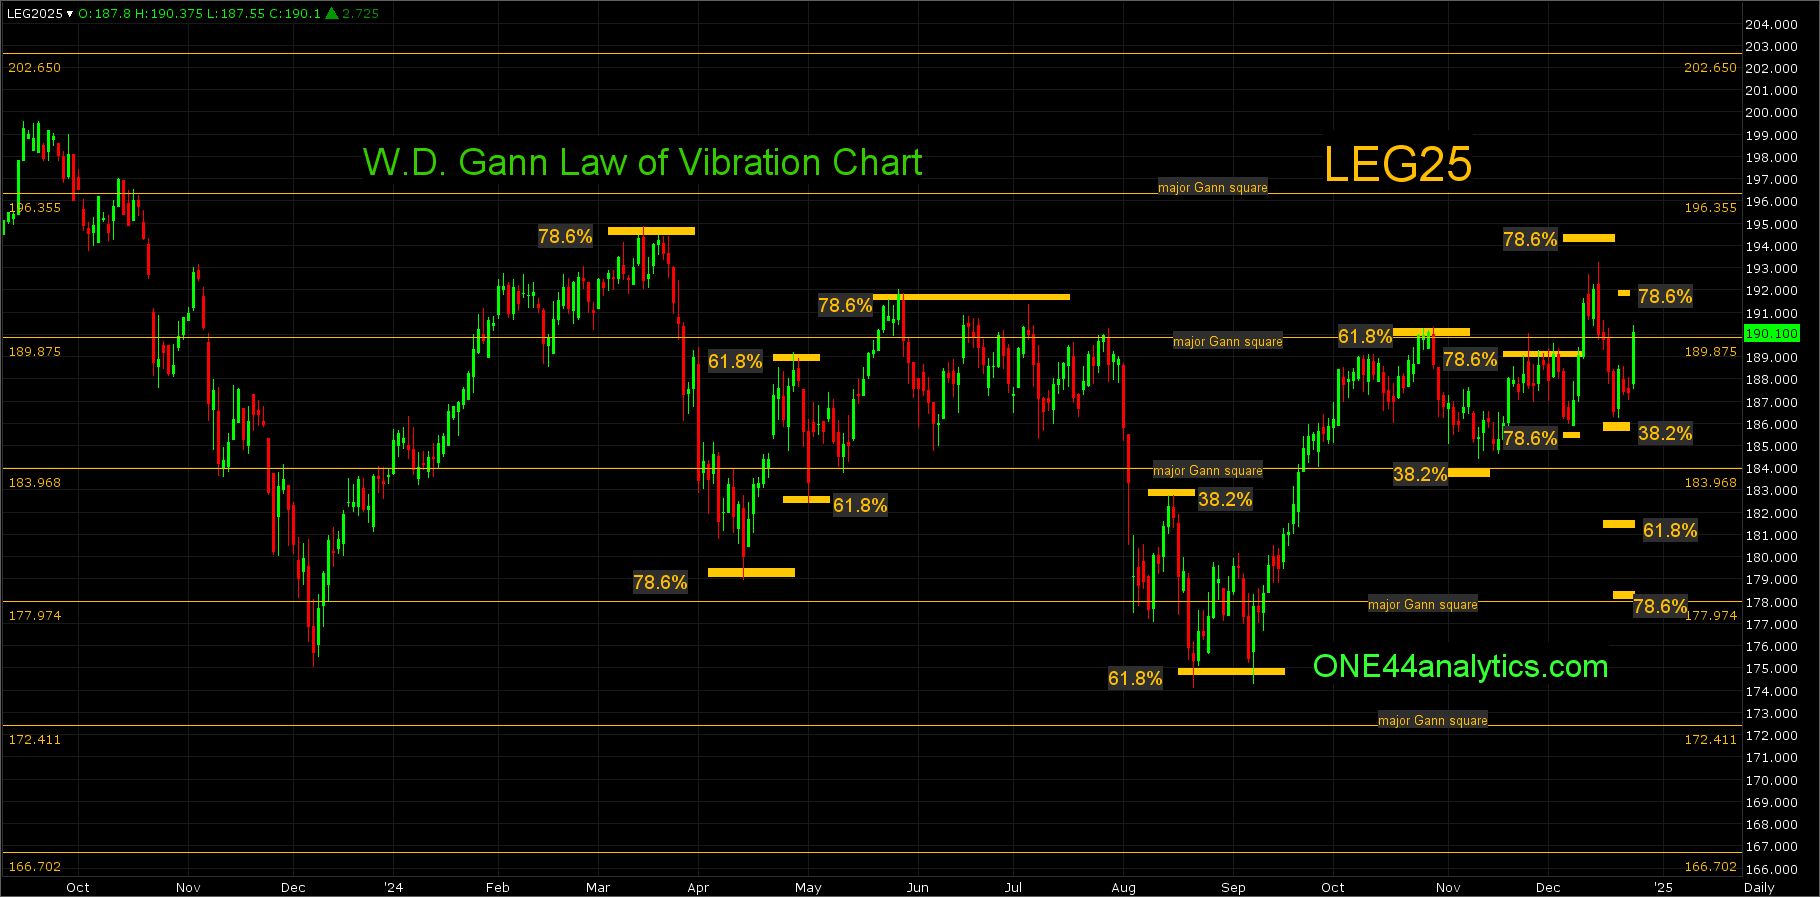
Cattle
February
From last week,
It put out a new high for the current leg, but fell short of 78.6% at 194.25 (193.22 high) and is now below 61.8% at 189.87. With the new high 38.2% moved up to 186.10 and today's low got close to this and it will be the key level for next week.
Use 186.10 as the swing point for the week.
Above it, holding a 38.2% retracement can send this market to a new high, per the ONE44 38.2% rule. Provided it makes a new....
We will still have to work off of the 38.2% (186.10) level and look for a new high above it (ONE44 38.2% rule), we will also watch 78.6% back to the high for any sign of a turn lower. The Above/Below remain the same from last week.
Use 186.10 as the swing point for the week again.
Above it, holding a 38.2% retracement can send this market to a new high, per the ONE44 38.2% rule. Provided it makes a new high continue to look for the area of 78.6% at 194.25 and the 196.35 major Gann square. A failure to turn lower from this area will give us only major Gann squares to look for resistance and then us as the swing point when closed above, the next one is 202.65. We will also watch 78.6% back to the 12/16/24 high at 191.80, a failure to make a new high in the area of a 78.6% retracement can be the end of the Bull run for now, per the ONE44 78.6% rule.
Below it, turns the trend negative and the short term target is 61.8% at 181.65. The long term target area is 78.6% at 178.50 and the 177.97 major Gann square.
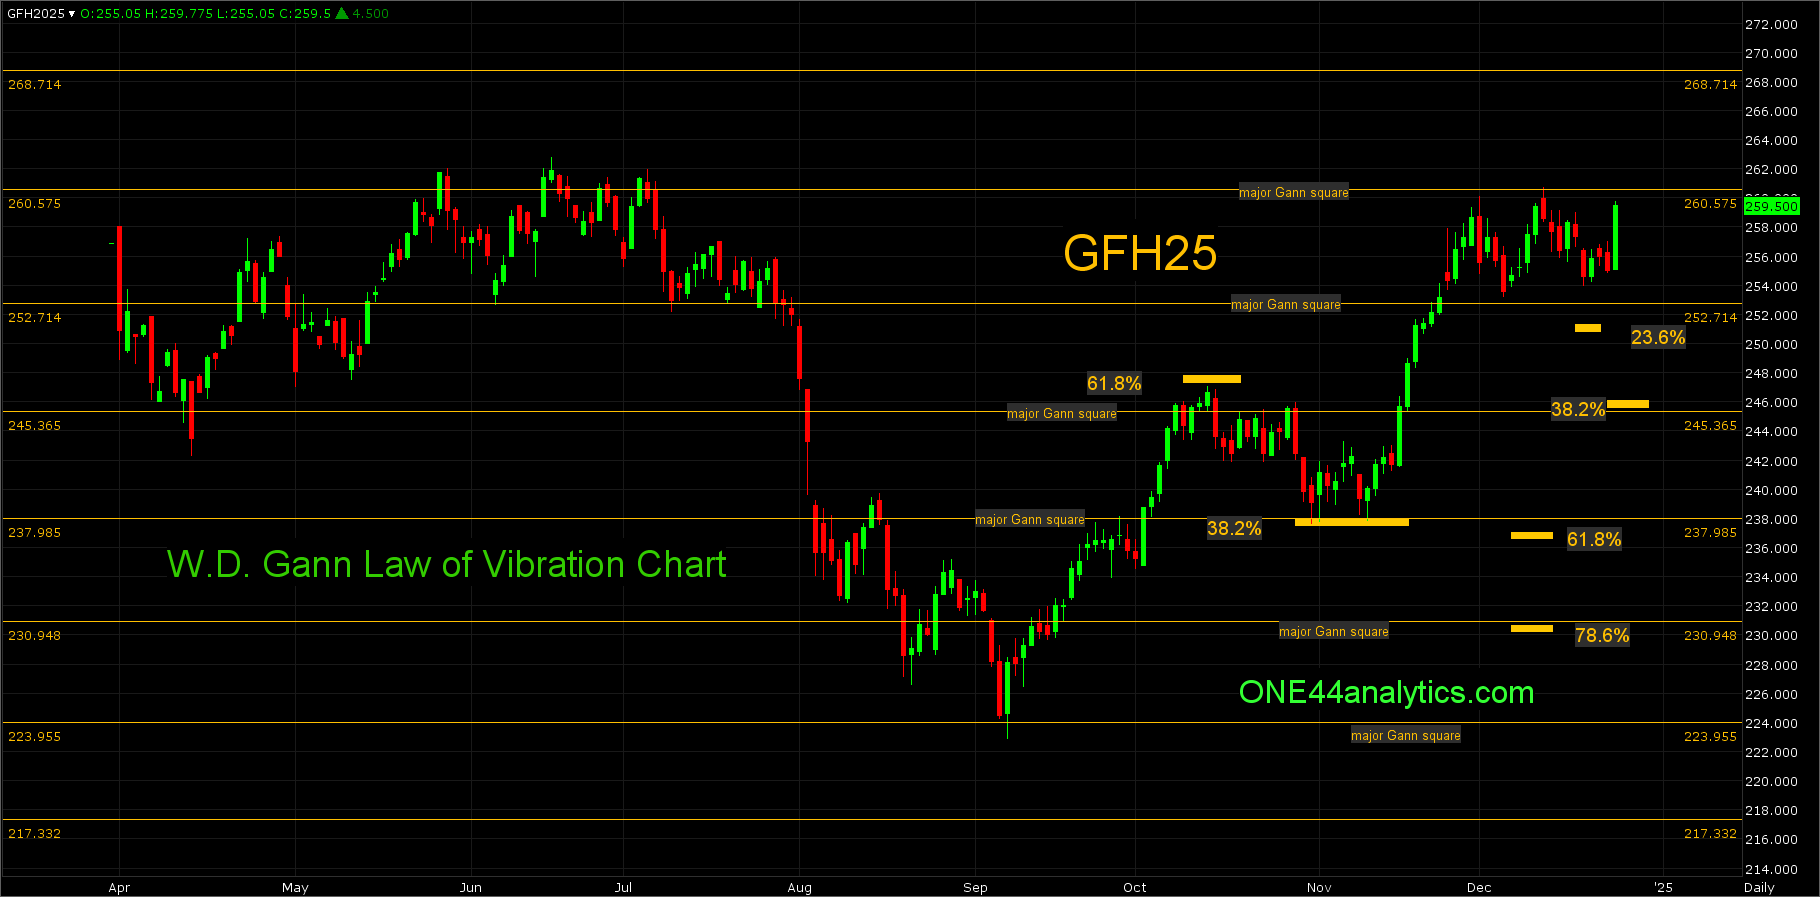
Feeder Cattle
March
From last week,
Use the 260.57 major Gann square as the swing point for the week.
This market has been unable to go even 23.6% back at 251.50 and this keeps the market extremely strong. The 260.57 major Gann square will again be key for this week. With no new high, all the Above/Below remain the same from last week.
Use 260.57 as the swing point for the week.
Above it there are only major Gann squares to look for resistance and then use as the swing point when closed above, the next one is 268.71.
Below it, the short term target area is 38.2% back to the 9/9/24 low at 246.10 and the 245.36 major Gann square. The long term target area is the 237.98 major Gann square and 61.8% of the same move at 237.15. Any setback that holds 23.6% at 251.50 is extremely positive and a new high can quickly follow.
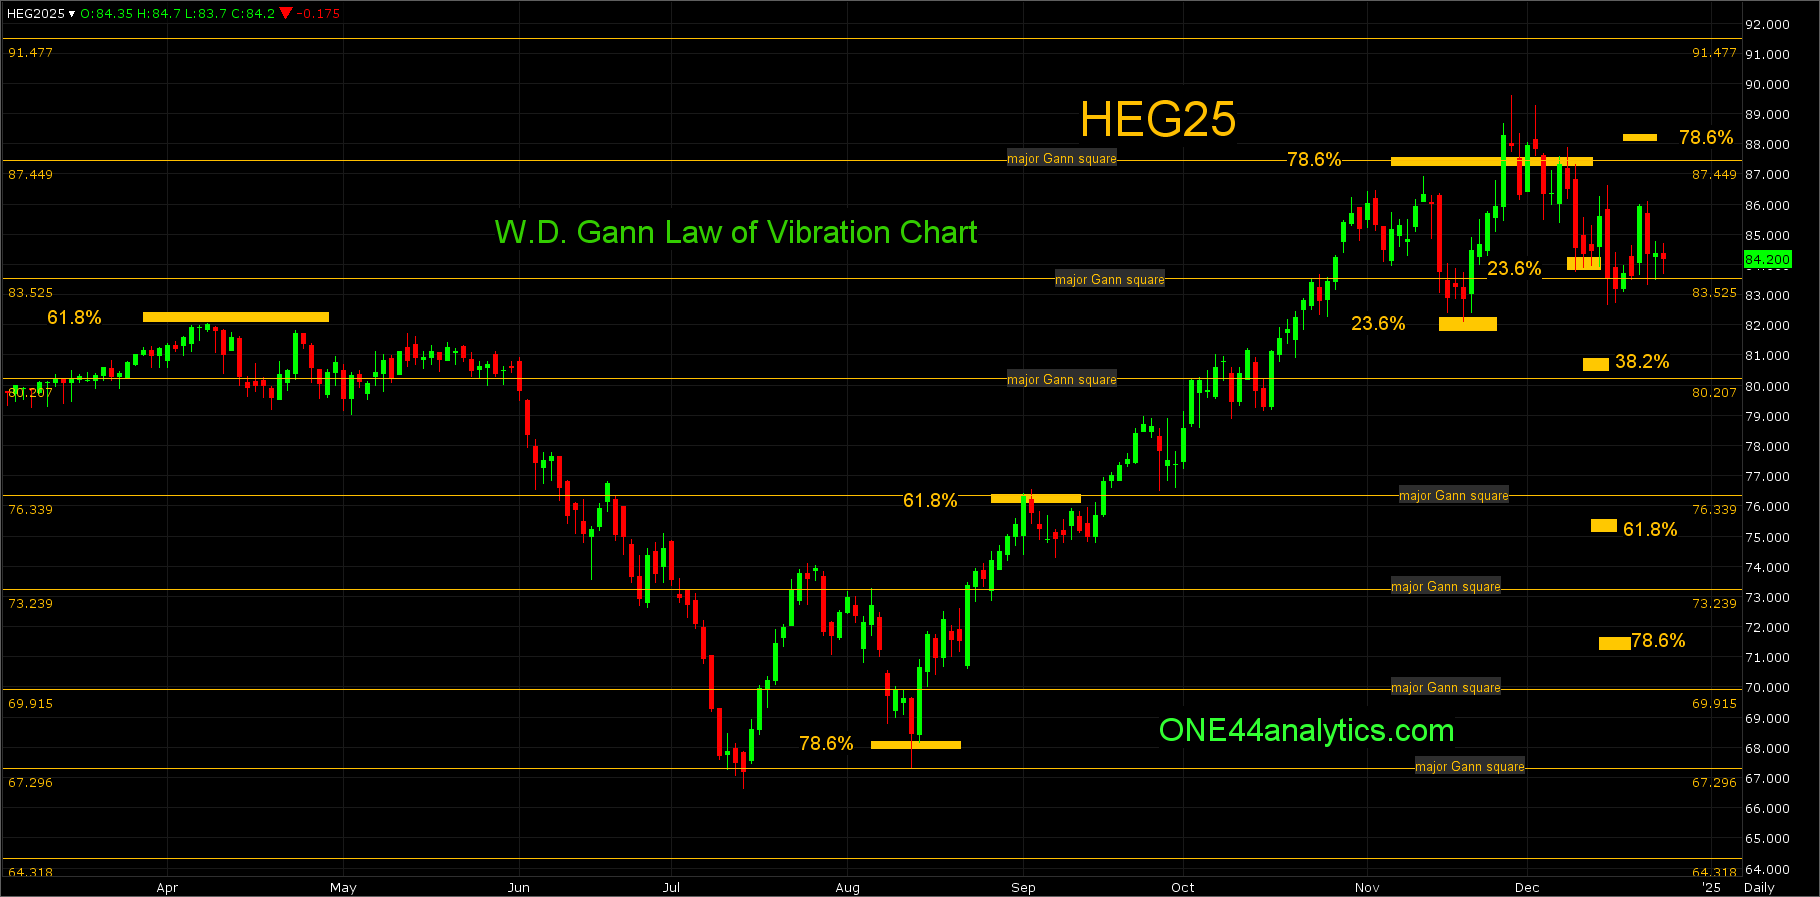
Lean Hogs
February
From last week,
The trade below 23.6% at 84.25 could only get one close below the 83.52 major Gann square and today closed right at it, this level will be key for the next week.
Use 83.52 as the swing point for the week.
All of this weeks trade held above the 93.52 major Gann square and this level will again be key for the next week. With no new low all the Above/Below remain the same for this week.
Use 83.52 as the swing point for the week.
Above it, look for 78.6% back to the 11/27/24 high at 88.12, a failure to make a new high in the area of a 78.6% retracement can cause the end of the Bull run for now, per the ONE44 78.6% rule. Above it there are only major Gann squares to look for resistance and then use as the swing point when closed above, the next one is 91.47.
Below it, the long term target remains at 78.6% the other way at 71.55, since it is coming off from a 78.6% level above at 87.44. The short term target area is 38.2% at 80.85 and the 80.20 major Gann square, holding this level keeps the long term trend positive and a run back to the highs can follow (ONE44 38.2% rule).