Weekly Grain update 3/20/22

Thank you to all the new subscribers
Our goal is to give you actionable as well as educational information. We will always try to be concise and to the point.
As a member, you will always have access to our premium members-only content right here on our website. New content and market analysis will also be delivered directly to your email inbox as soon as it's released. You may see some parts of the members section posted on Barchart.com, or the homepage to draw more interest to the website and service.
Just a quick note, we have recently fixed a setting that was causing some emails to not be delivered to certain domains - this should now be resolved. If you have signed up with an alternate address, you will likely now get the email to both inboxes. You can use the Account section to set your email preferences.
It is very important to remember that the Fibonacci retracements are in a constant state of flux, just as the markets are and this is why we always say,
We will watch all the retracements on every move to see just how strong, or weak the market is regardless of the longer term target.
Wheat
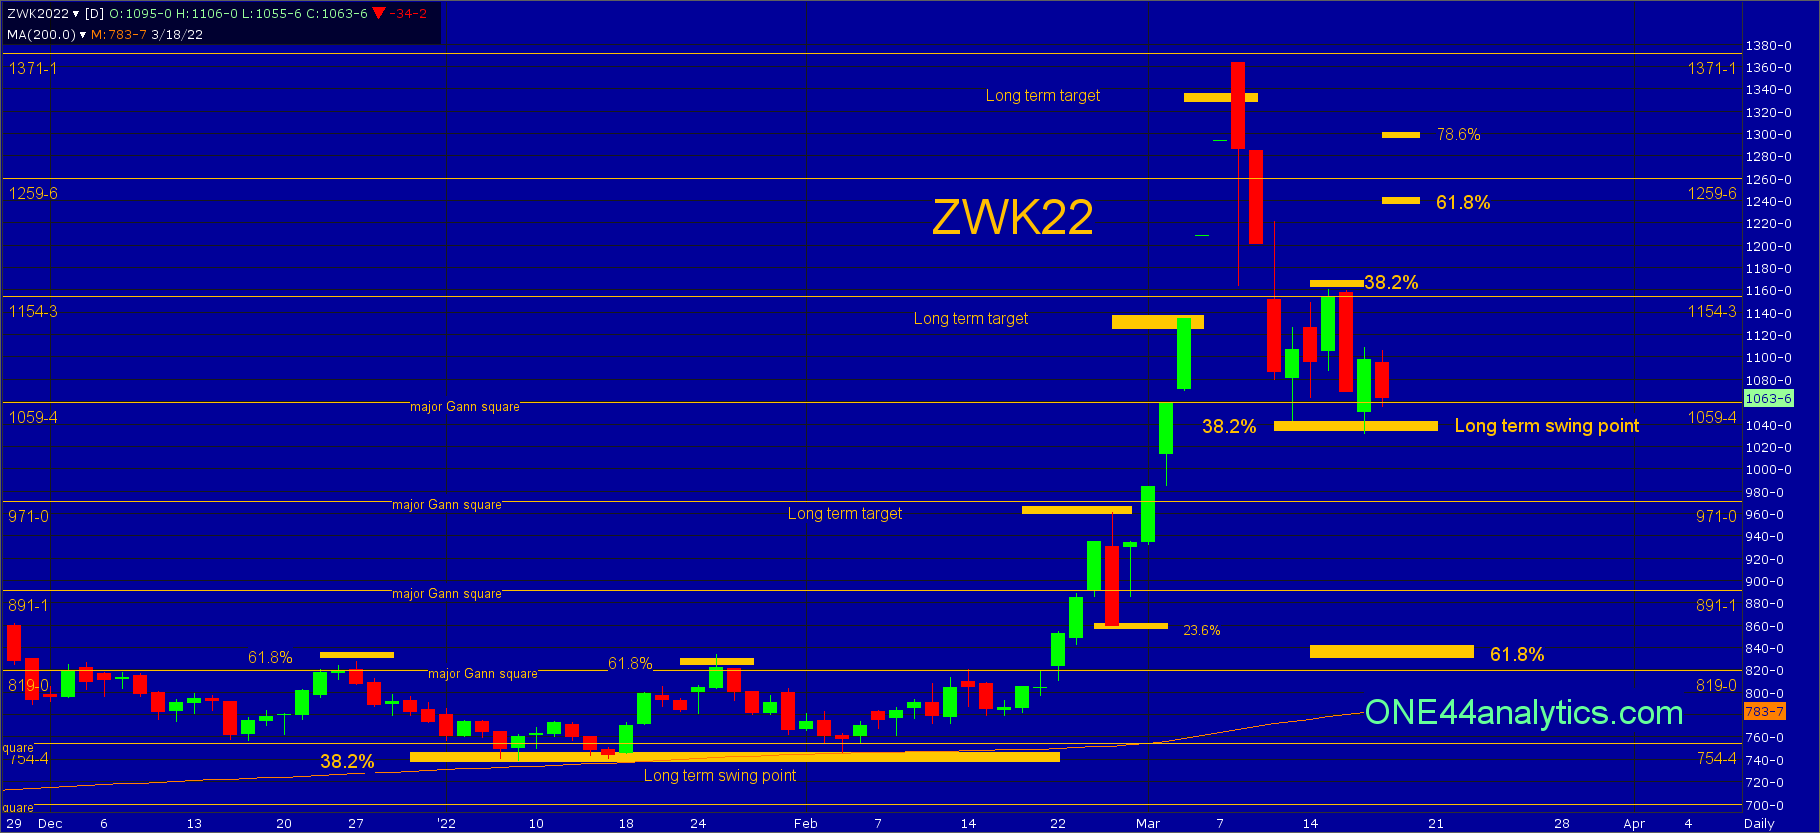
Last Friday it fell just short of the long term swing point of 1041.00 and we left you with this,
The long term target on a rally from here will be new highs for the move and as always we will watch all the retracements on the rally to see just how strong it is. The first key level is 38.2% back up at 1162.00, there is also a major Gann square at 1154.00, if this is all it can rally after hitting the long term swing point it is a negative sign.
May Wheat hit the 1154.00 major Gann square and missed 1162.00 by less than 2 cents. It is not a good sign to be turned back lower by a 38.2% level from a smaller range, especially one that has hit the long term swing point. The break from 1162.00 (38.2%) took it to a new low for the move to complete its target based on the 38.2% rule, however only making a slightly lower low brings us to another part of that same rule,
When the market holds 38.2% and the reaction does not make a new high/low, or a slightly higher high/lower low, this is a sign the trend is changing and because they have already reacted from 38.2% you should look for 61.8% of that same move as well. One another note, when dealing with large ranges, you will always have to see how they react when they get back to the 38.2% level the second time, as this is the most important retracement.
So, it has made a slightly lower low, but never took out the long term swing point on a closing basis. We know by holding the long term swing point the long term target is a new ATH. As for a shorter term target, now that it already reacted from 38.2% at 1162.00, the next target is 61.8% at 1237.00. All of this is based on it continuing to hold the long term swing point of 1041.00.Failing to hold the long term swing point will give us a downside target of 61.8% at 843.00.
Law of Vibration chart for short term support and resistance

Hourly Fibonacci chart
For short term levels

Corn
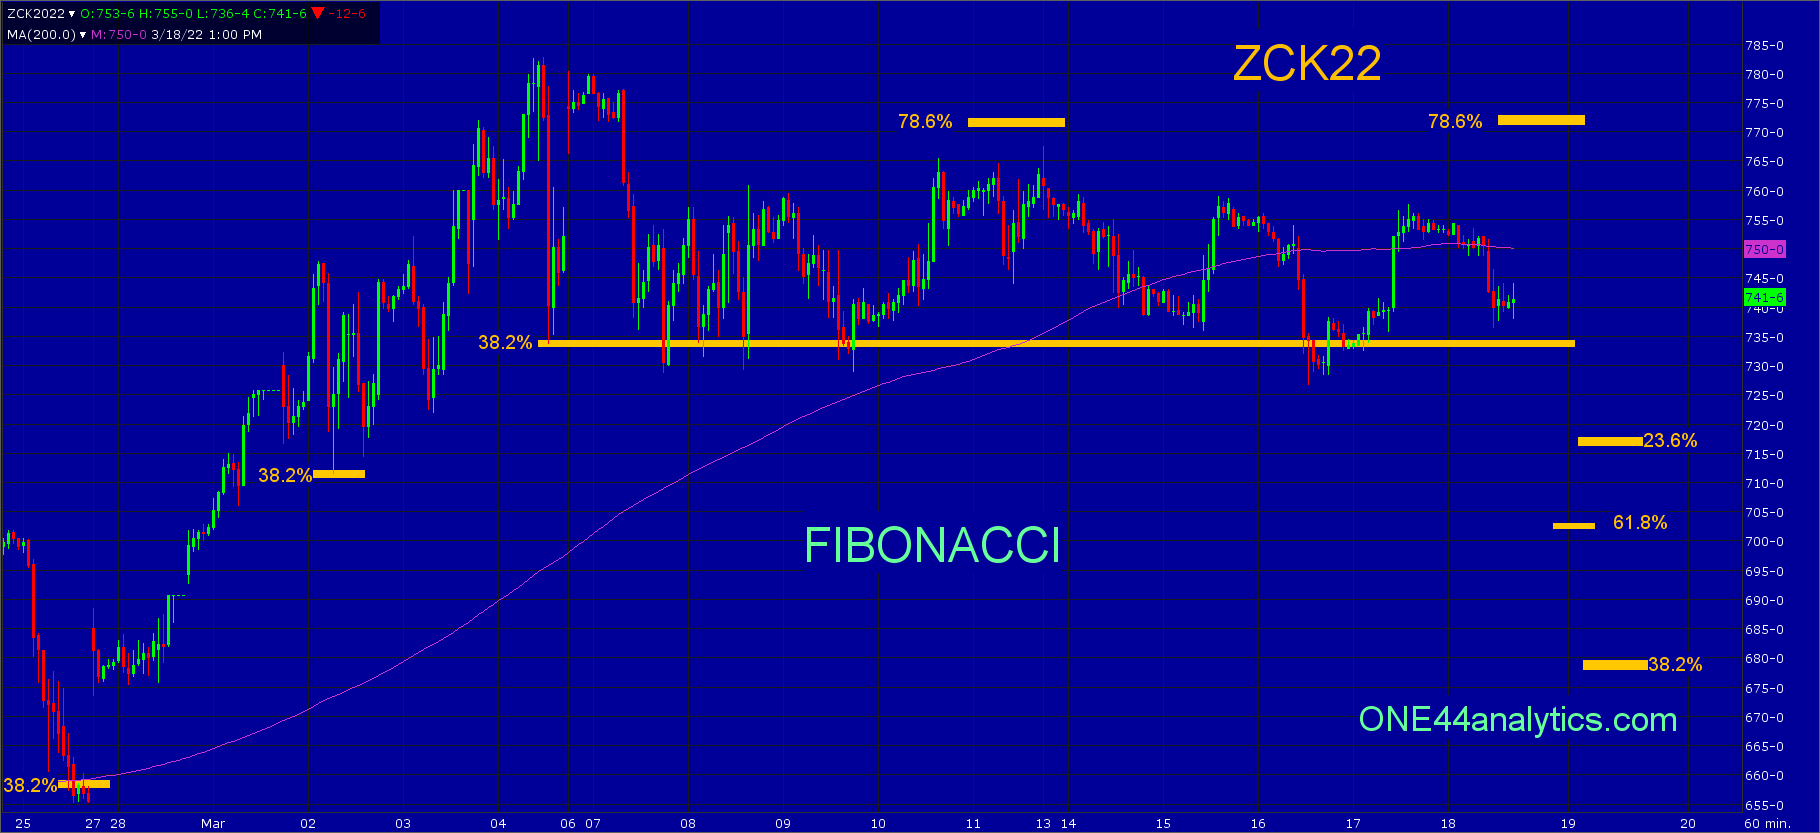
Corn continues to be in an extremely strong position. It is sitting on the 734.00 major Gann square (use this as the short term swing point) that is also 38.2% of the last leg up and the upside target is the 810.00 major Gann square. Below 734.00 look for the area of 685.00 to 680.00, this 23.6% back to the contract low and 38.2% back to the 5/26/21 low, this was the last time it held the long term swing point. On a bigger setback look for the new long term swing point of 625.75. Short term above, any rally from the 734.00 level that fails to make a new high around the 78.6% level at 771.00 can send this market on a quick move lower.
Hourly Fibonacci chart
For short term levels
Law of Vibration chart for short term support and resistance

Soybeans
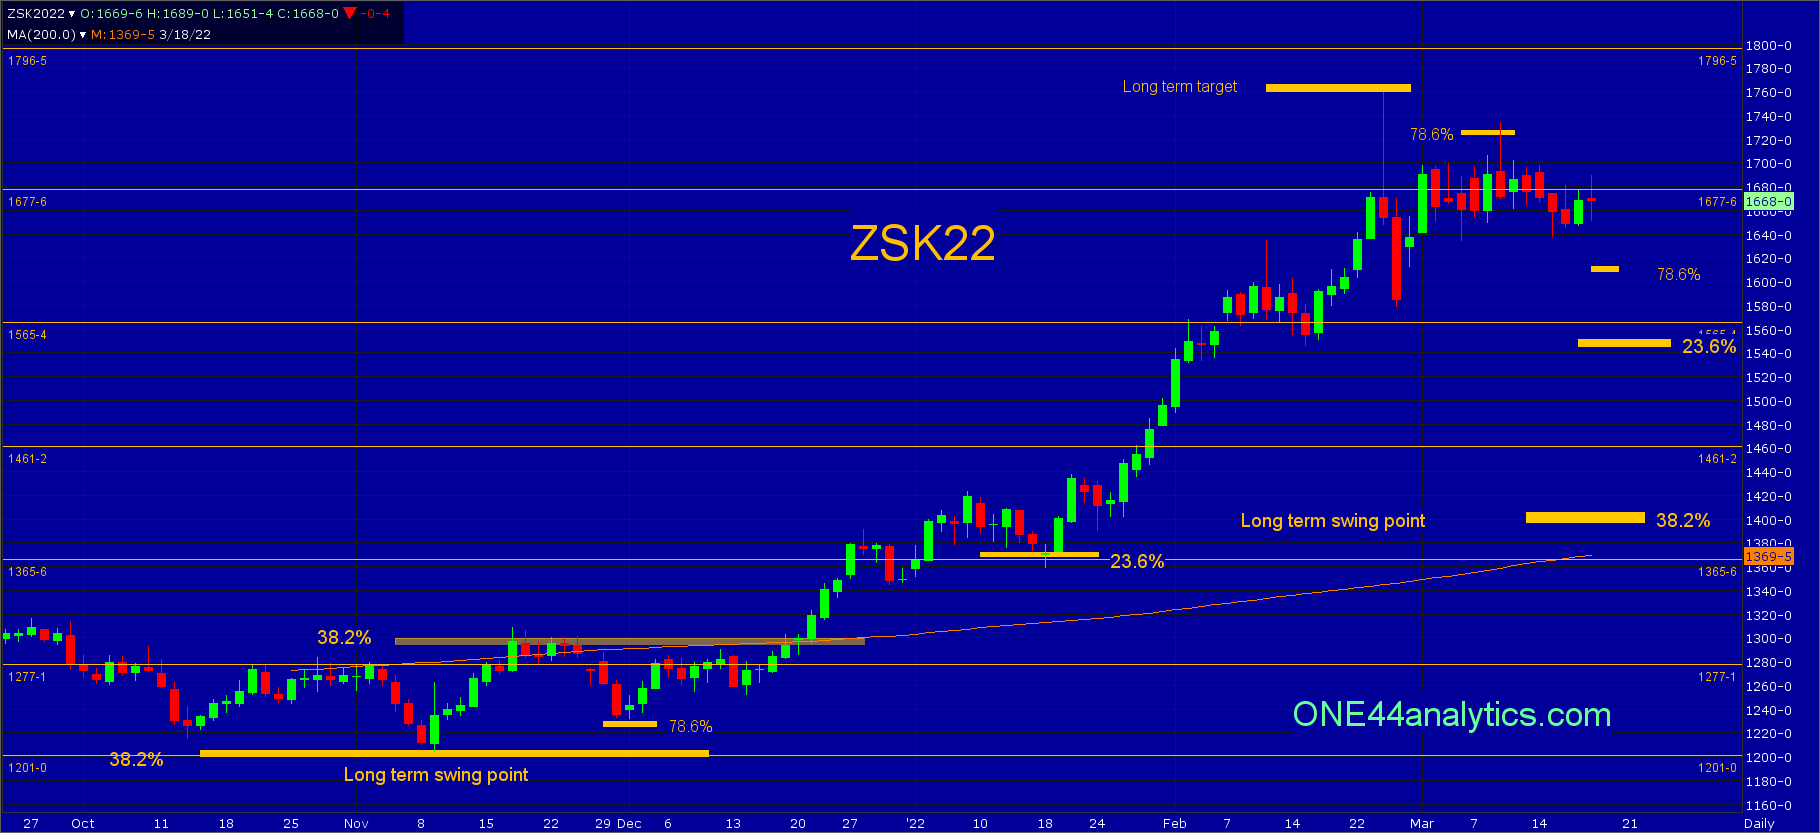
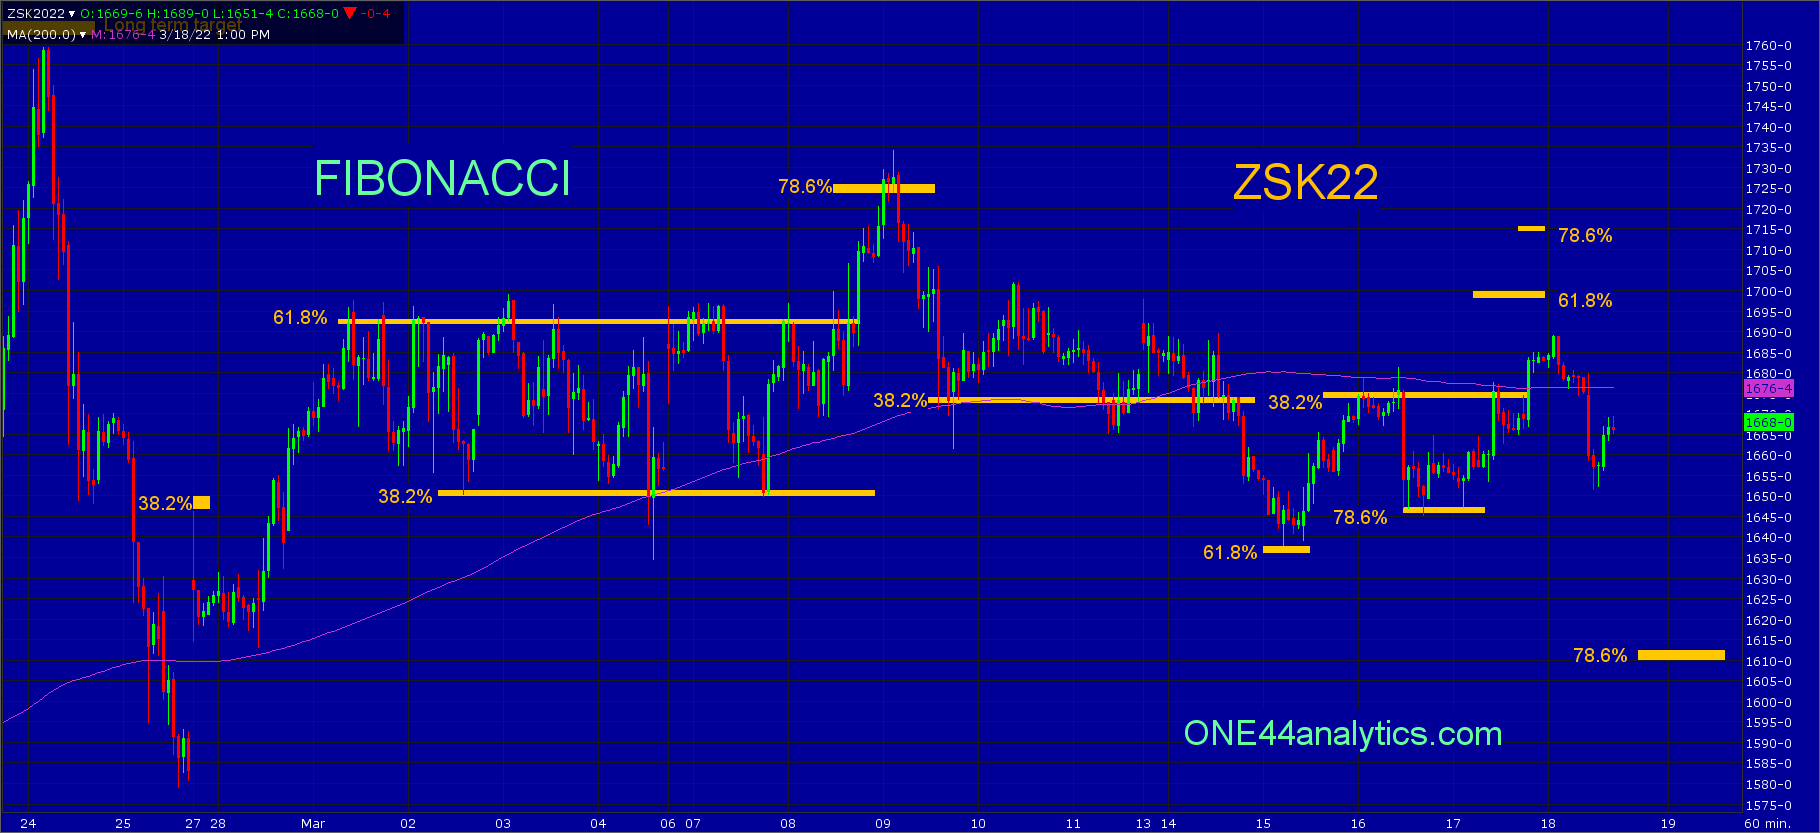
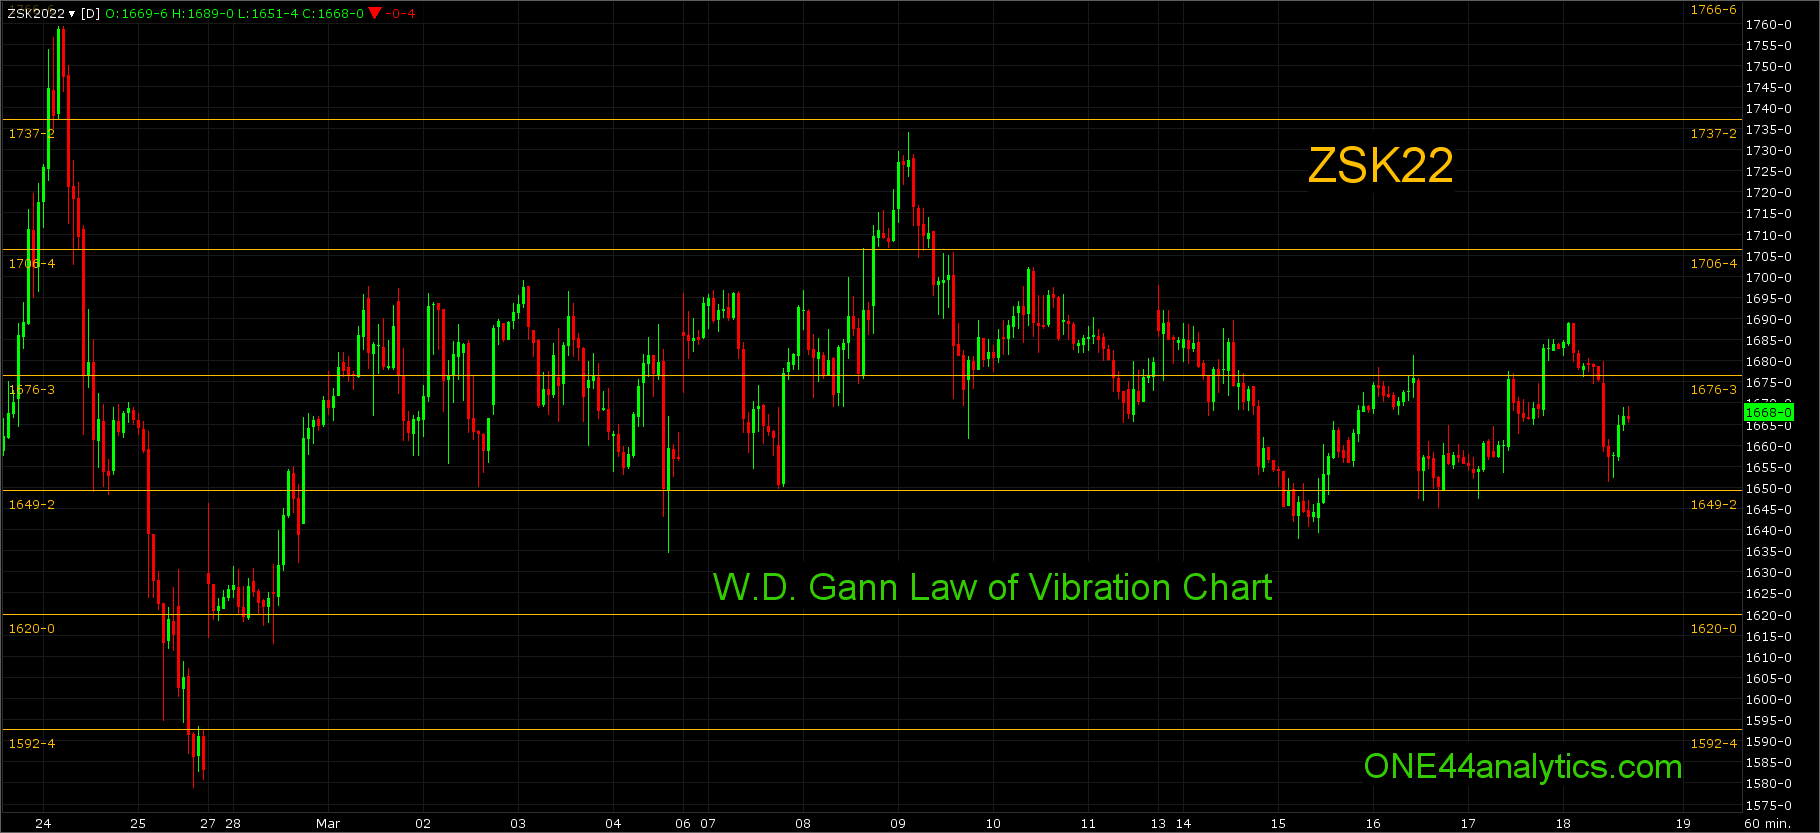
Not much happened this week in Beans, we are still looking for the 78.6% retracement at 1612.00 after hitting 78.6% above. Short term you can use the 1677.75 major Gann square as the swing point. Above it look for 78.6% at 1715.00, below 78.6% at 1612.00. These levels are on the Fibonacci chart below. For now all of this from last week remains the same,
It hit 78.6% on Wednesday and has come off 60 cents so far, the first target based on the 78.6% rule is to go 78.6% of where it just came from and this is now 1612.00, if this is all it can setback after hitting the long term target of 1765.00 and then 78.6% on a retest of that high, it would be a very positive sign for the market, however the second part of the 78.6% rule is, that it can be the end, or start of Bull runs and after hitting the long term target above, the longer term target will be the long term swing point of 1405.00. Before this is another area of key support between 1565.00 and 1550.00, this is first a major Gann square and secondly 23.6% back to the contract low and 38.2% back to the last time they held the long term swing point on 11/9/21. We will be reassessing the market whenever one of these key levels is hit. For now we are looking for 1612.00 to start. The next long term target with a solid close above 1765.00 will be 2003.00.
Hourly Fibonacci chart
For short term levels
Law of Vibration chart for short term support and resistance
Soybean Meal
May Meal hit the 490.00 long term target a couple times this week and again closed below the 479.00 major Gann square, Below it look for the next major Gann square at 450.80, this is also 23.6% of the 10/13/21 low. With a solid close above 490.00 look for the next major Gann square at 507.30. The long term swing point is now 426.50, this 38.2% back to the 10/13/21 low, with a major Gann square at 427.10, this is the longer term target on a break from 490.00. Short term, it held 38.2% of the last leg up, use it as a swing point, above look for 78.6% at 487.00, below it 61.8% at 461.00. These levels are on the Fibonacci chart below.

Hourly Fibonacci chart
For short term levels

Law of Vibration chart for short term support and resistance

Soybean Oil
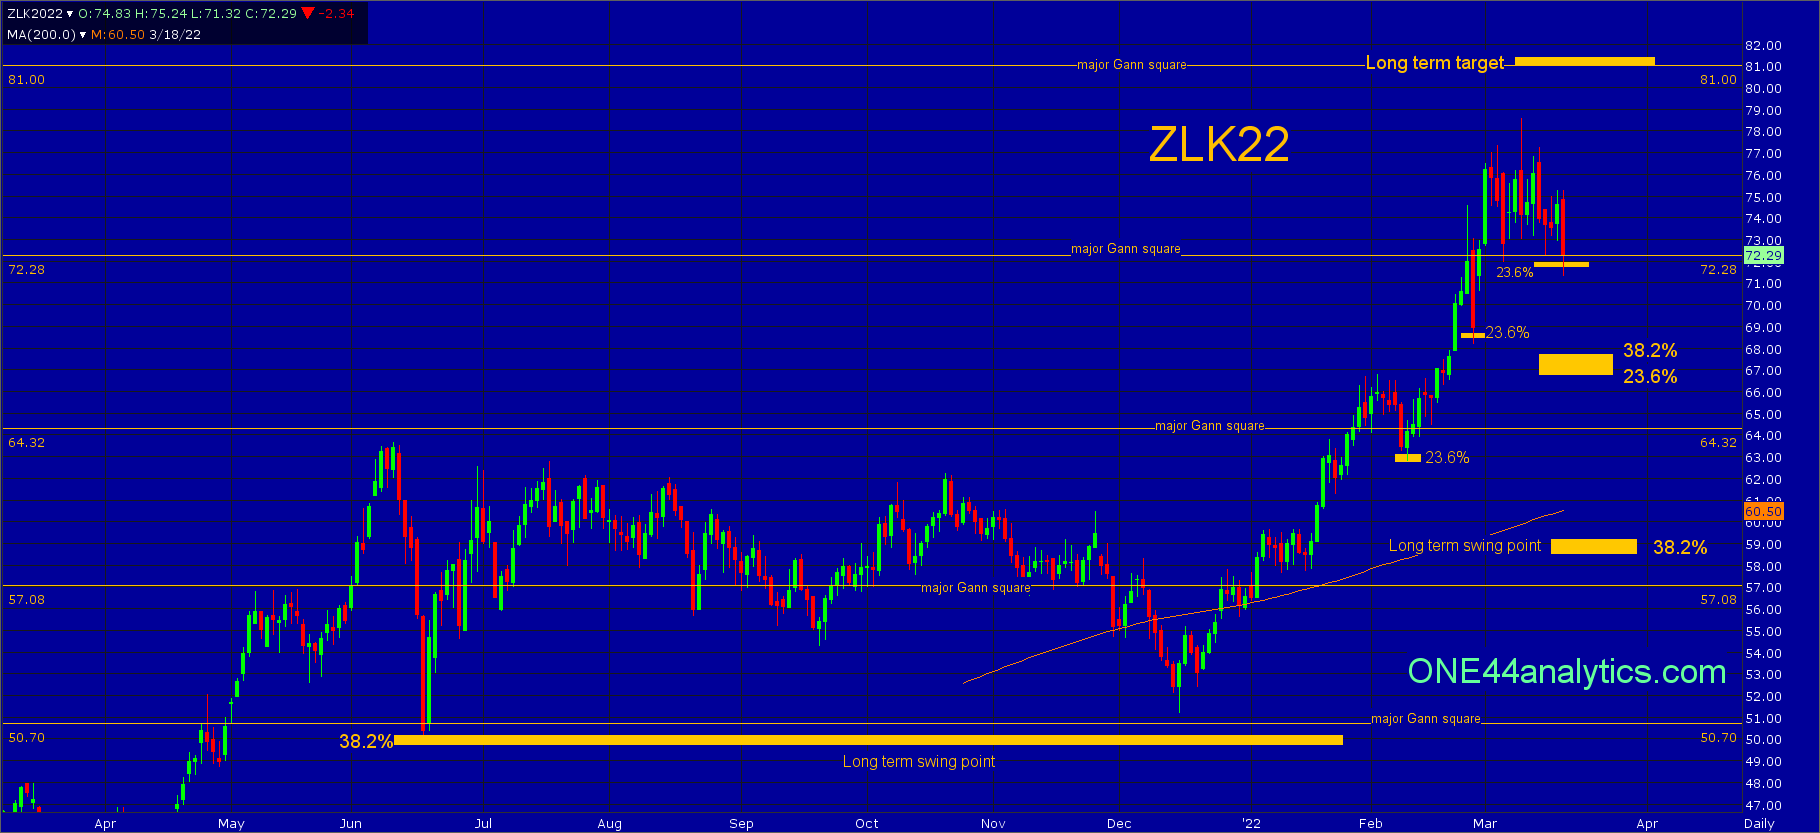
Oil held 72.01 (closing basis), this is 23.6% back to the 6/17/21 low (this was the long term swing point at that time) and closed right at the 72.28 major Gann square. Use this as the short term swing point, above it look for the long term target of 81.00, below it look for the combination area of 67.65 to 66.76, this is 38.2% of the last leg up and 23.6% of the contract high and low. The long term swing point is now 59.30.
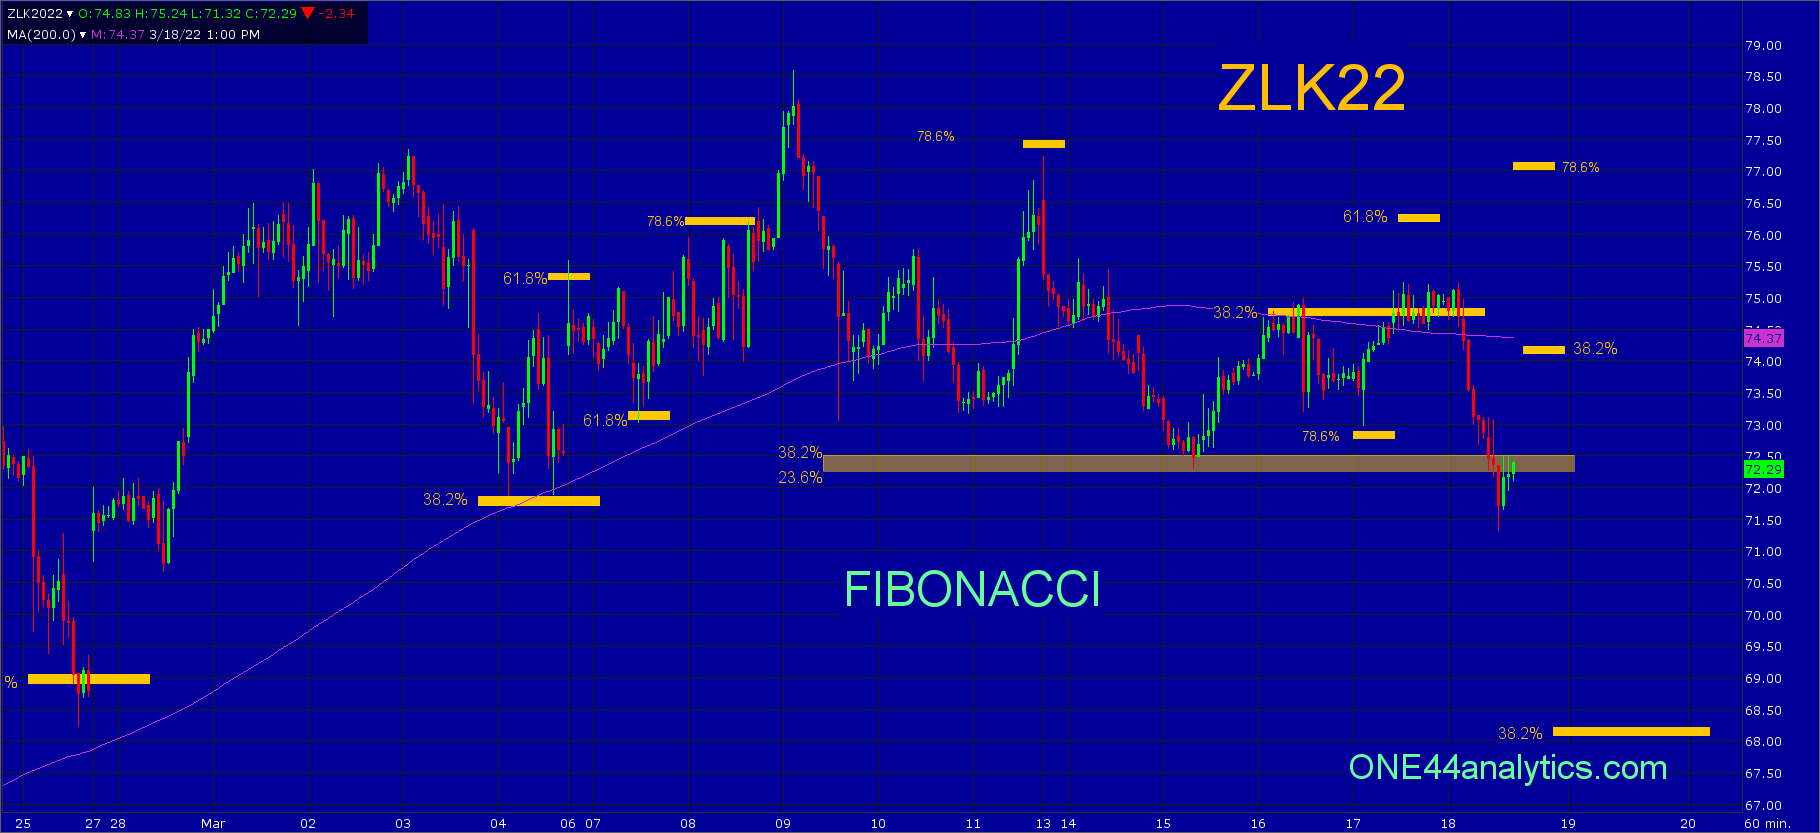
Hourly Fibonacci chart
For short term levels
As you can see on the hourly chart we had the area of 72.50 to 72.25 as a combination of 38.2% and 23.6% as key short term support (this was on last weeks chart as well). It held this area on 3/15/22 and was only able to get up to 38.2% before going back and taking out the 3/15/22 low. Just as the Wheat did on the daily chart, the low so far is slightly lower than the previous low and closed right in between the key short term support. This becomes the short term swing point for another reason other than it being a major Gann square on the Daily chart. A rally from 72.50 to 72.25 can send this to new highs, however we watch all the retracements to see just how strong, or weak the market is. Any rally that can't get above 38.2% at 74.10 would be a negative sign after hold key support below. The target on a failure from there would be new lows and then 38.2% back to the last long term swing point, this is 67.75, this is also the target on a failure to rally again from the 72.50 to 72.25 area. Above 74.10 look for 78.6% at 77.00.
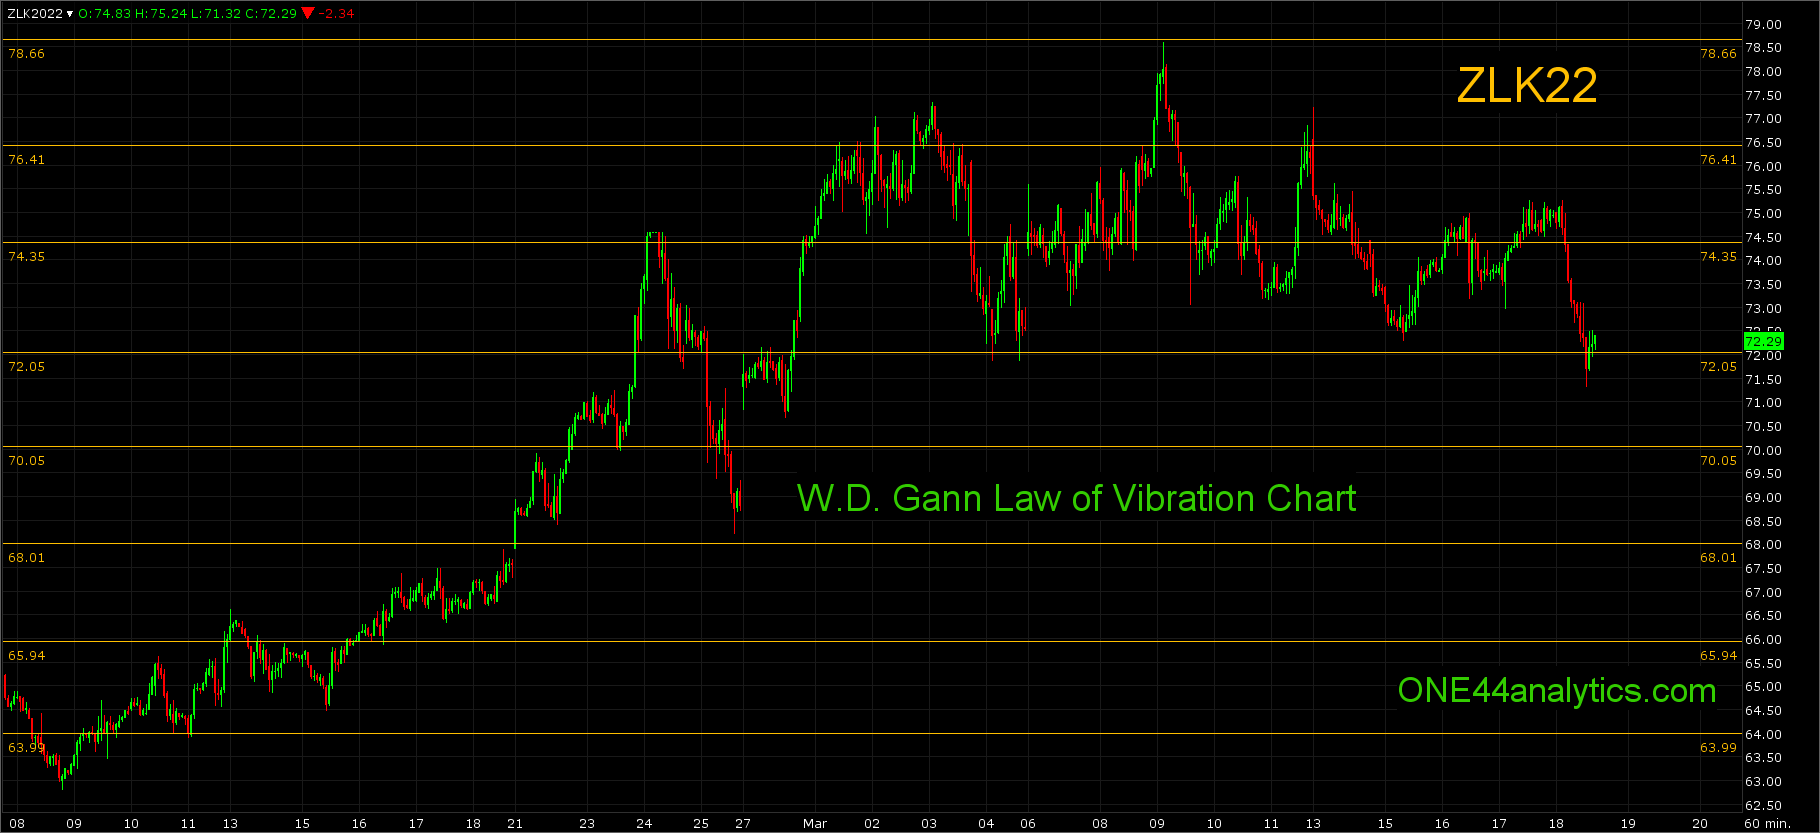
Law of Vibration chart for short term support and resistance
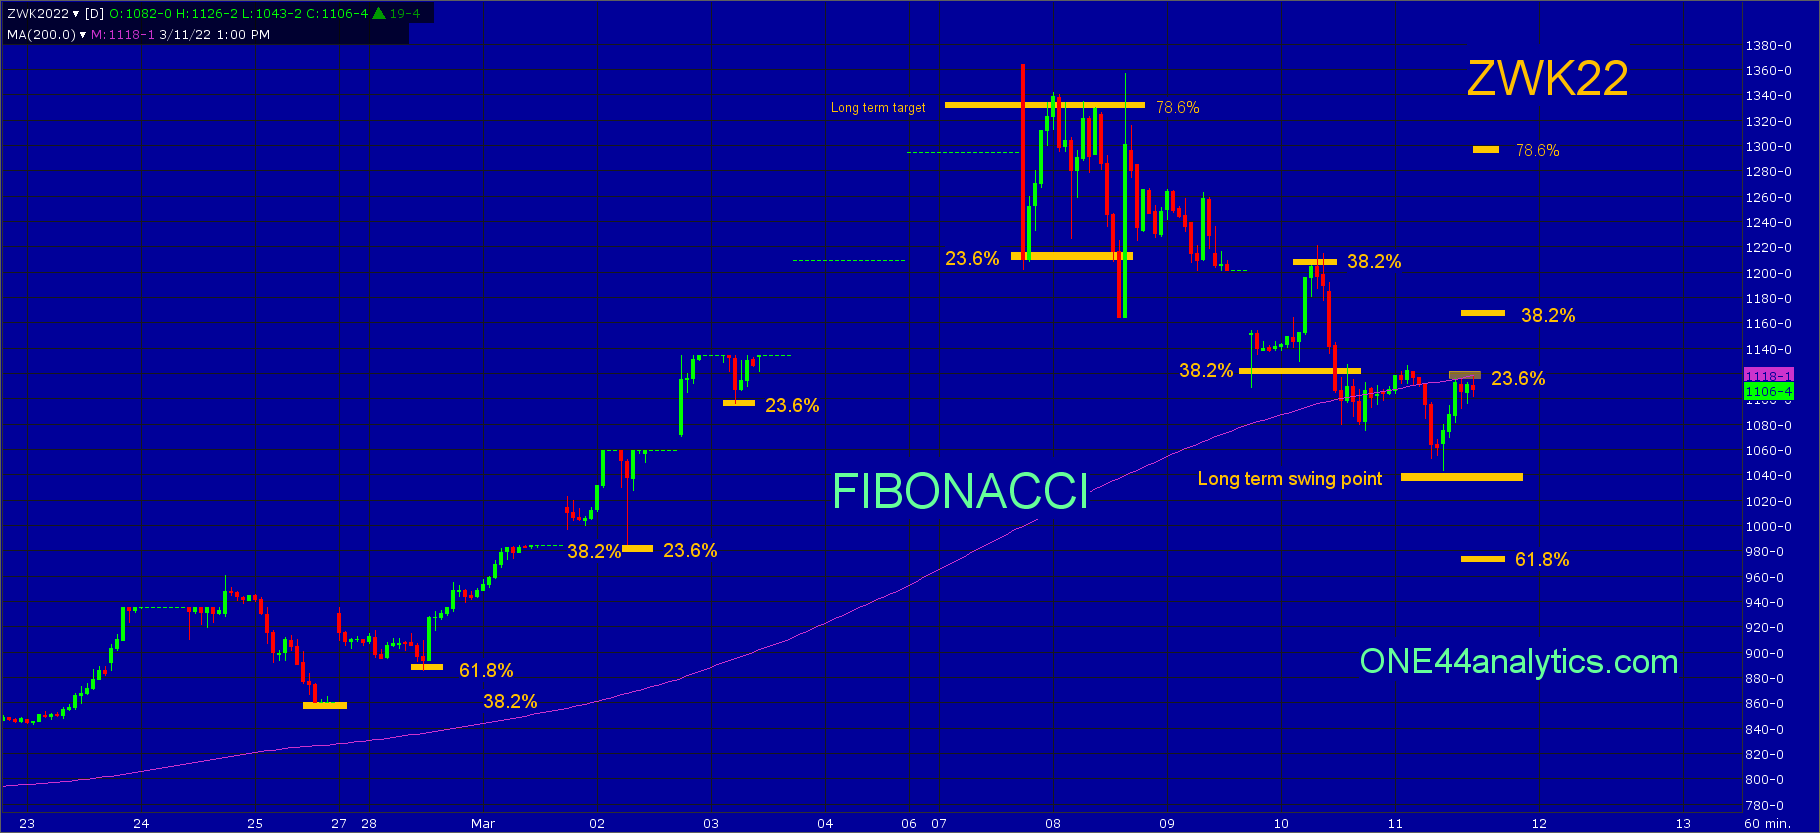
This is a follow up to the Wheat hourly chart from last week
Previously we took it from the contract high to the long term swing point,
The break from 1363.50 went right to 23.6% at 1214.00 and the rally from it failed to make a new high as would be needed to keep the short term trend very positive. After not making the new high it took it 38.2% of the same move at 1125.00. We would be looking for a new high from this retracement per the ONE44 Fibonacci 38.2% rule, even so we will watch all the retracements to see just how strong , or weak the market is regardless of the longer term target. The rally from there could only go 38.2% back to the contract high, this was 1205.50. As a rule of thumb whenever a retracement from a smaller move turns the market after holding 38.2% of a much bigger move, it is not a good sign and the break from 1205.50 took it to a new low and the long term swing point.
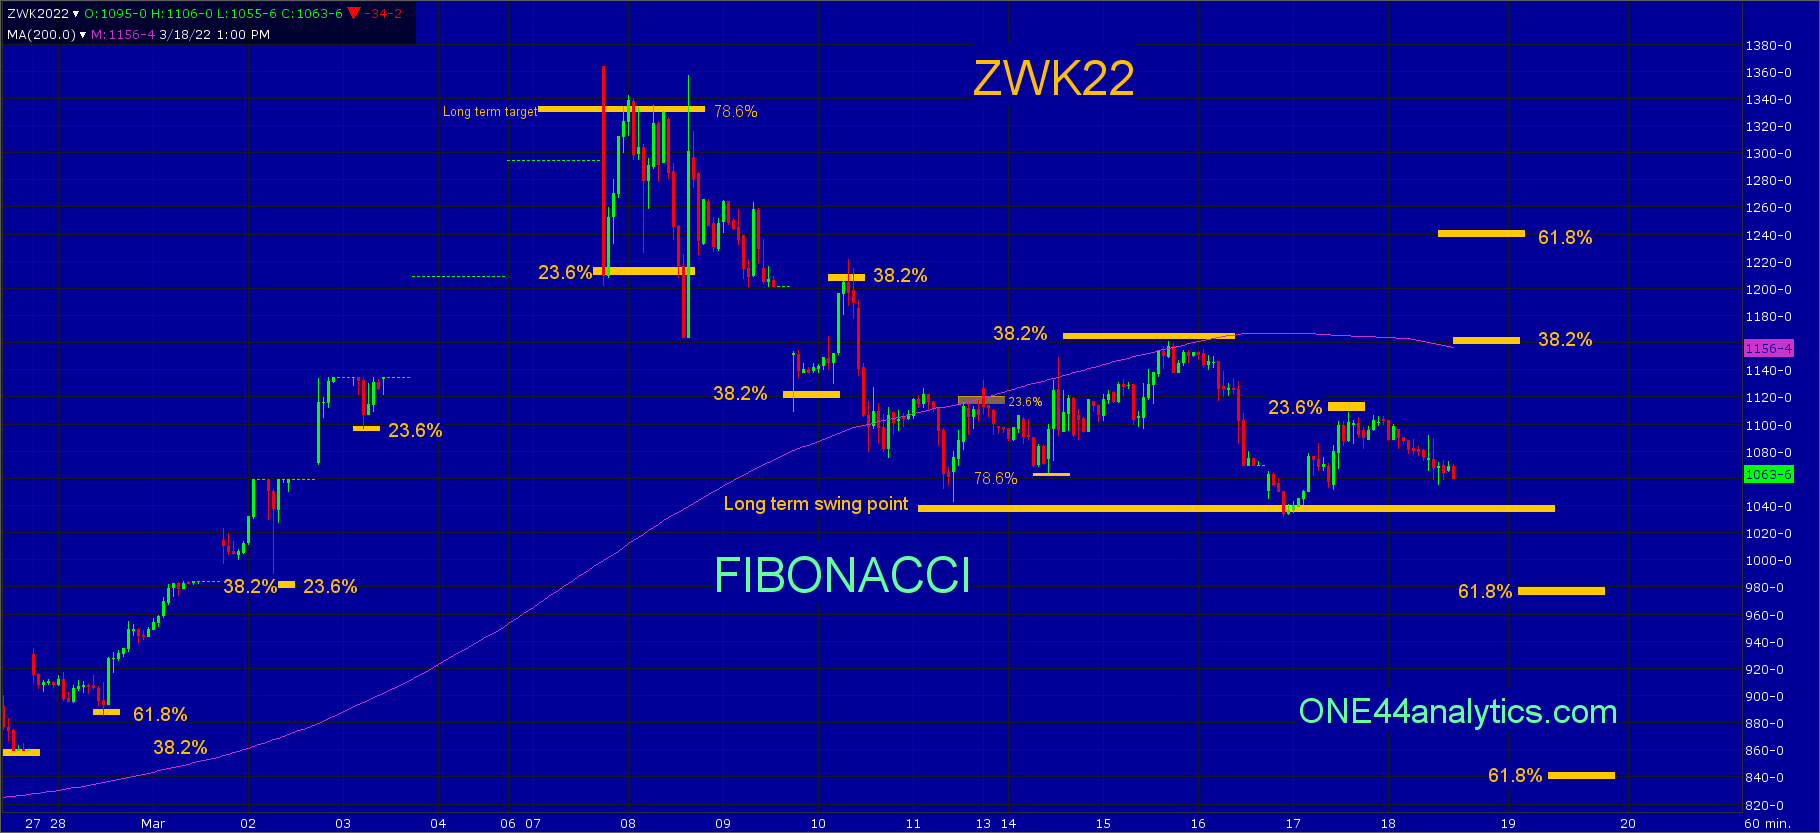
This past week, the Sunday night high hit 23.6% at 1115.00 the break from it failed to make a new low and held 78.6% at 1065.00 and the 78.6% rule is,
Any market that hits 78.6% should go 78.6% back the other way. This is also where a lot of Bull markets end and start.
It did hit the first target of the rule by going back 78.6% to the 1115.00, however the second part of the rule was stopped by 38.2% back to the contract high, this was 1162.00 and mentioned in last weeks update as a key level. The break from it sent it to new lows per the 38.2% rule,
38.2% is the single most important retracement and is the level we use for the "Golden Rule". This rule being, " any market that is going to keep it's current trend must hold 38.2%". As long as it does the trend will continue and it should make new highs/lows from that retracement.
When it made that low, it was only slightly lower and this is a second part of the 38.2% rule,
When the market holds 38.2% and the reaction does not make a new high/low, or a slightly higher high/lower low, this is a sign the trend is changing and because they have already reacted from 38.2% you should look for 61.8% of that same move as well.
The target on a rally from 1041.00 is now 61.8% at 1238.00 since they already reacted from 38.2% (1162.00). The rally so far has only gone 23.6% back at 1109.00, if this is all it can rally look for new lows and then a short term 61.8% level at 978.00. On a continued rally from 1041.00 you should still watch 38.2% again even though the longer term target is 61.8%. It will need to take out 1162.00 to turn the short term trend positive to get in sync with the long term trend. Provided this does happen you can go to the daily chart for long term levels.
FULL RISK DISCLOSURE: Futures trading contains substantial risk and is not for every investor. An investor could potentially lose all or more than the initial investment. Commission Rule 4.41(b)(1)(I) hypothetical or simulated performance results have certain inherent limitations. Unlike an actual performance record, simulated results do not represent actual trading. Also, since the trades have not actually been executed, the results may have under- or over-compensated for the impact, if any, of certain market factors, such as lack of liquidity. Simulated trading programs in general are also subject to the fact that they are designed with the benefit of hindsight. No representation is being made that any account will or is likely to achieve profits or losses similar to those shown. Past performance is not necessarily indicative of future results.