Soybeans fail at 23.6%
ONE44 Analytics where the analysis is concise and to the point
Our goal is to not only give you actionable information, but to help you understand why we think this is happening based on pure price analysis with Fibonacci retracements, that we believe are the underlying structure of all markets and Gann squares.
For the ONE44 Fibonacci rules and guidelines to help with this article, go here.
Charts are courtesy of Barchart.com
Soybeans
This was the post on 10/17/21
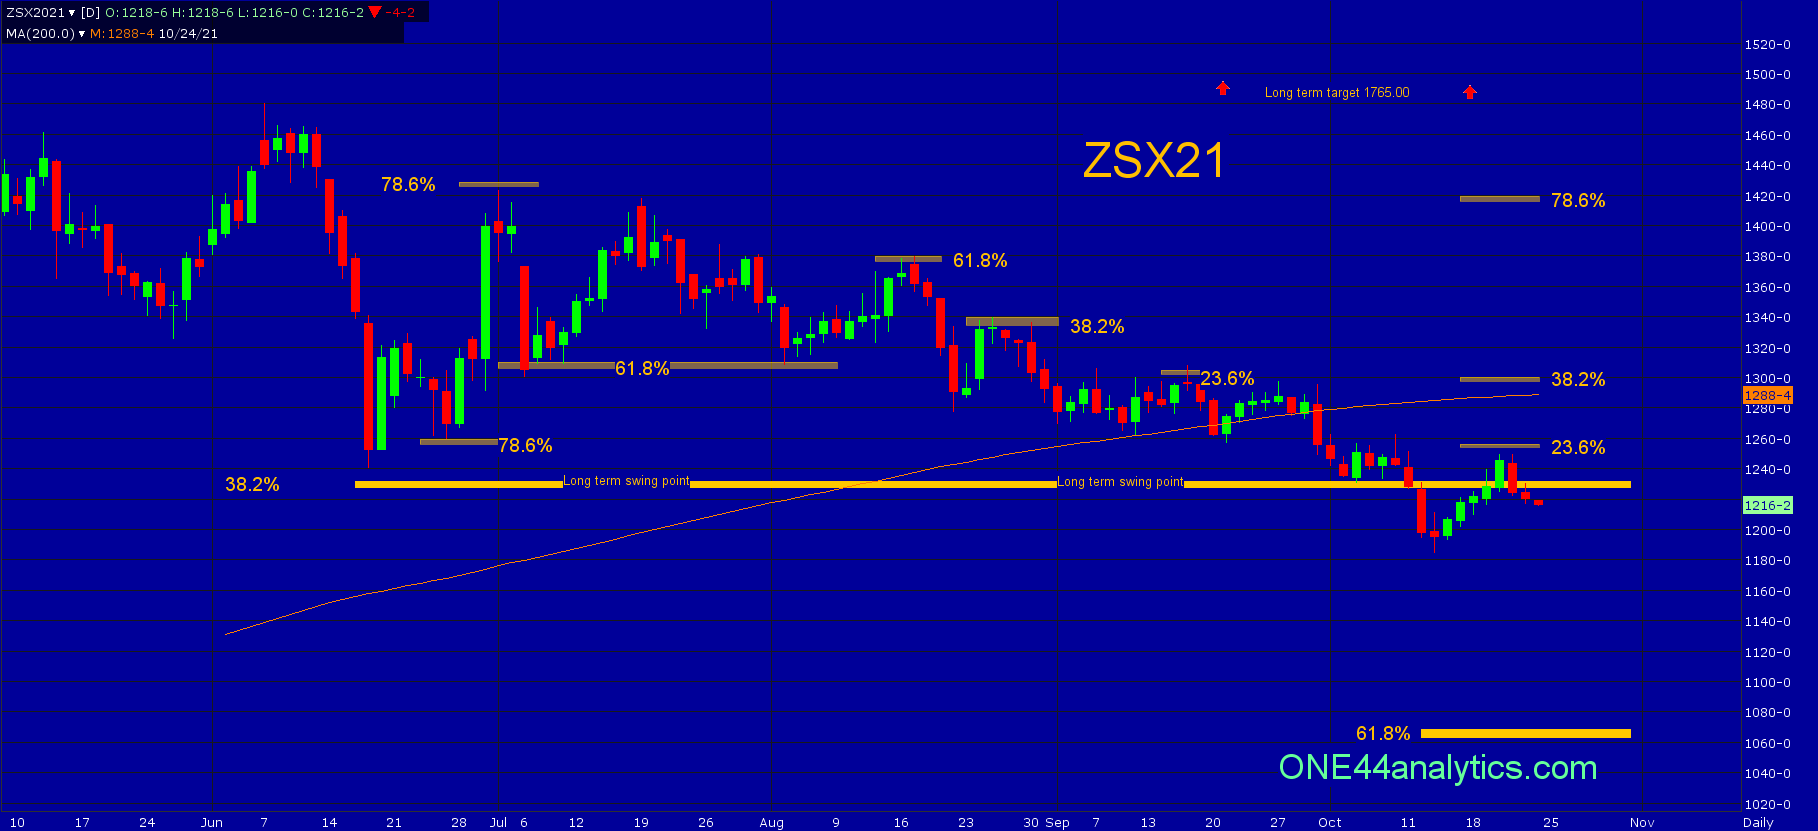
The quick break we were looking for after taking out the 1235.00 long term swing point has not materialized, however as long as it remains below it, the target is 61.8% at 1070.00. The long term swing point (1235.00) is also now 23.6% back to the high on 8/17/21 and 38.2% back to the high on 9/16/21 adding to the importance of this level. With a solid close back above it, look for 38.2% back to the contract high, this is 1302.00 and the short term swing point. Once this level is taken out the short term trend turns positive and you can then look to the longer term levels on the chart. Any rally back above the long term swing point that does not get above 23.6% at 1254.00 is very negative.
Currently,
The one close back above the 1235.00 long term swing point failed to get above 23.6% of the contract high at 1254.00 keeping the trend very negative, the high was 1249.50. With the close back below the long term swing point it brings back the downside target of 61.8% at 1070.00.
Getting back above 1235.00 would turn the long term positive again, however it would still have to get above 38.2% at 1302.00 to turn the short term trend positive. Doing this would also get it back above the 200 day moving average that is currently at 1288.00. Provided they can do this look for 78.6% at 1415.00 to start and then the long term target.
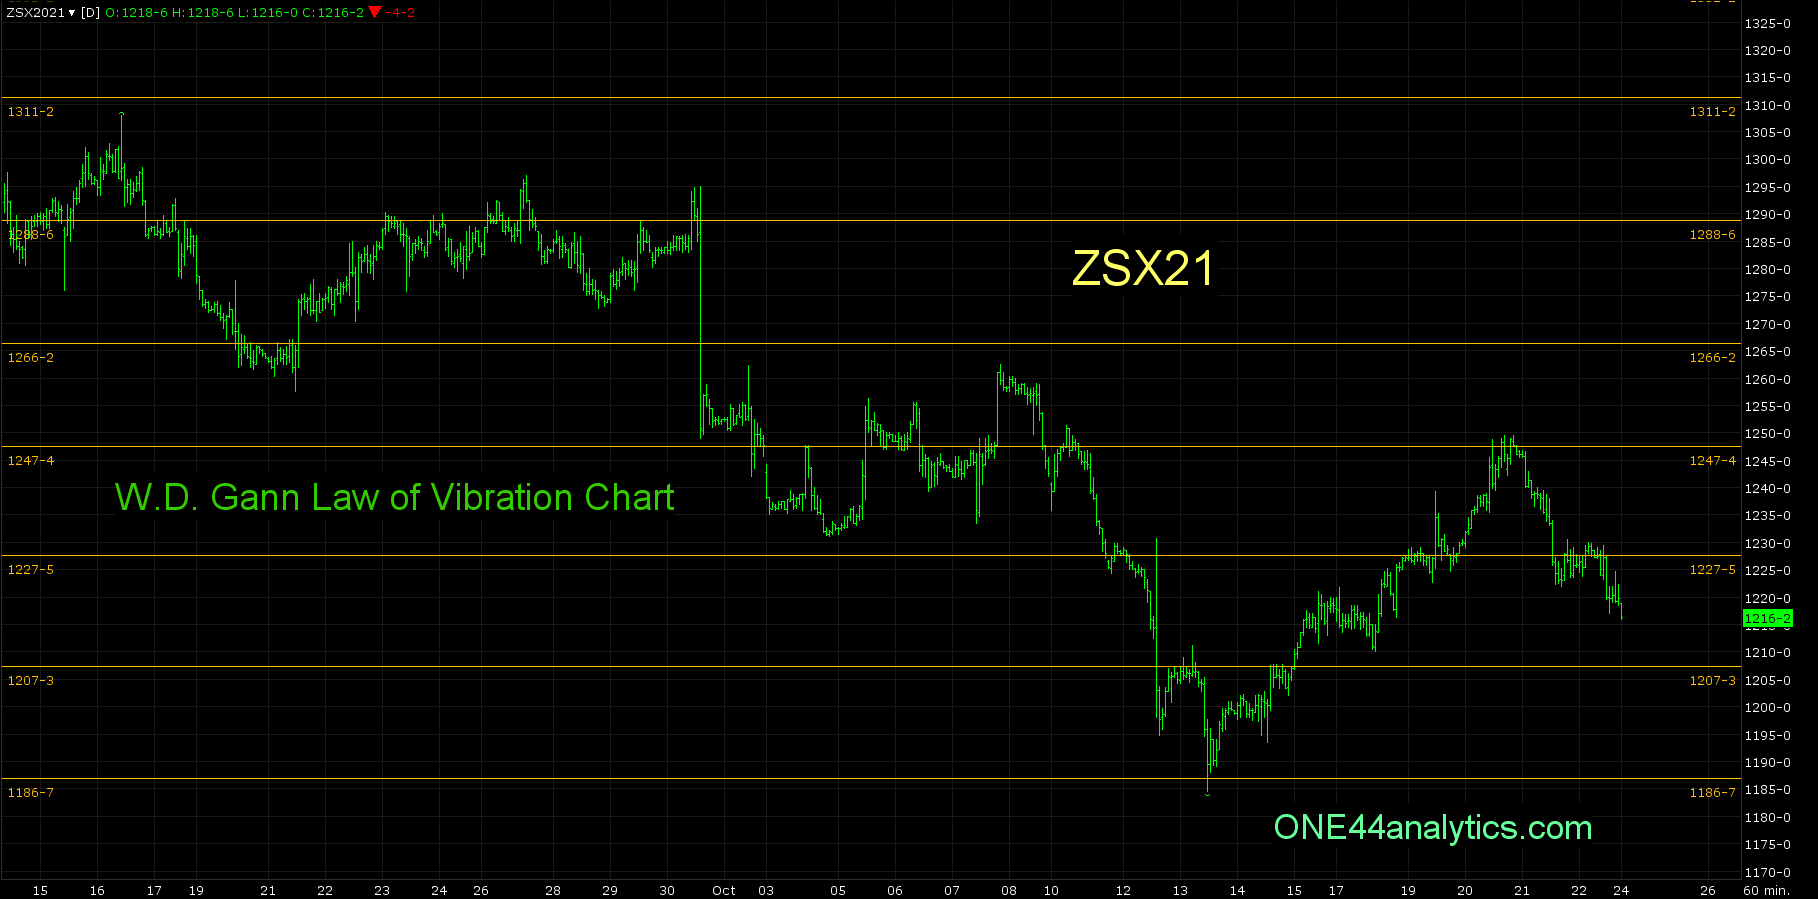
You can use the Gann Law of Vibration chart below for short term support and resistance.
Sign up for our Free newsletter here.
FULL RISK DISCLOSURE: Futures trading contains substantial risk and is not for every investor. An investor could potentially lose all or more than the initial investment. Commission Rule 4.41(b)(1)(I) hypothetical or simulated performance results have certain inherent limitations. Unlike an actual performance record, simulated results do not represent actual trading. Also, since the trades have not actually been executed, the results may have under- or over-compensated for the impact, if any, of certain market factors, such as lack of liquidity. Simulated trading programs in general are also subject to the fact that they are designed with the benefit of hindsight. No representation is being made that any account will or is likely to achieve profits or losses similar to those shown. Past performance is not necessarily indicative of future results.