FAANG Update
Starting with the 200 day moving averages in each, in AMZN it is 3143.00 and they are trading below it. NFLX is right on it at 507.75, AAPL is just above it at 117.30 and FB and GOOGL are well above theirs, 264.90 and 1703.50.
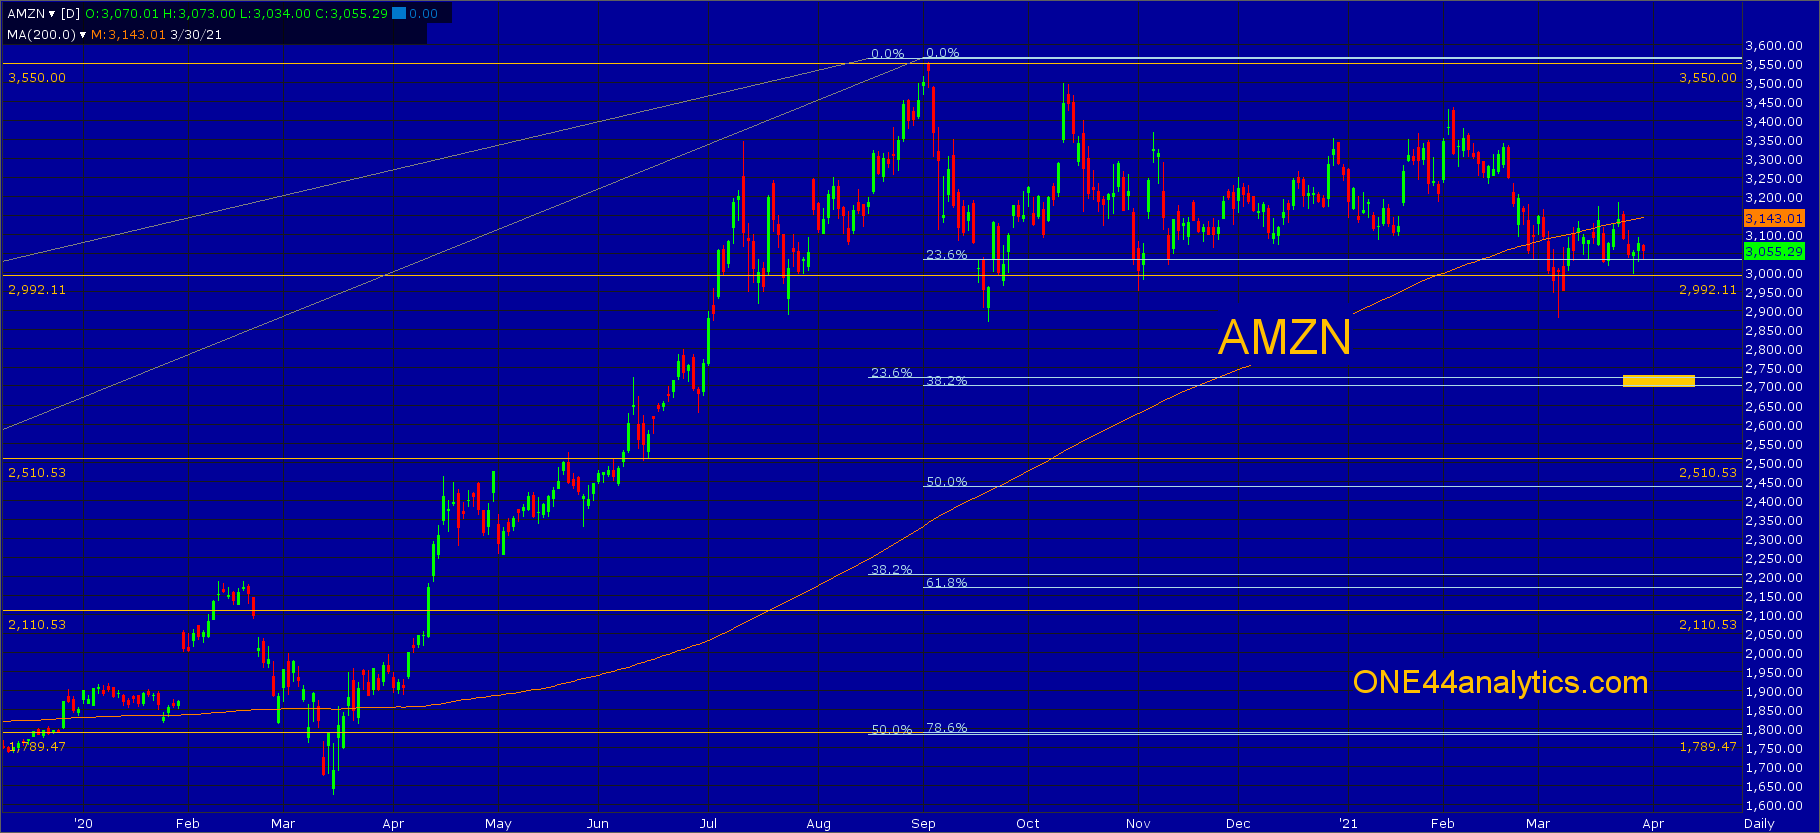
AMZN
Even though AMZN is trading below the 200 day, it has been sitting on the 2990.00 major Gann square since September of last year and above 3030.00 this is 23.6% back to the 2018 low. As long as it continues to close above 2990.00 look for 3275.00 and then the 3550.00 major Gann square. Any rally that fails to get back above the 200 day is negative and with a couple solid close below 2990.00 look for the combination of retracements between 2725.00 and 2700.00. The first is 23.6% back to the ATL and the second is 38.2% back to the 2018 low.
NFLX
The last two bounces from the 200 day were only able to get to 38.2% (532.00) back to the ATH, this is also a major Gann square. A close above 532.00 should send them up to the 578.00 major Gann square again. On a failure to hold the 200 day, look for 455.00, this is 23.6% back to the ATL and 38.2% back to the 2018 low.

AAPL
AAPL is just above the 200 day at 117.30 and most of the last five weeks trading has been right on the 120.00 major Gann square, however the last two bounce have only gone 38.2% back up. Provided they hold the 200 day and close above 38.2% at 127.50, look for the 145.00 major Gann square again. On a failure to hold the 200 day look for the combination area of 112.00 and 110.00, this is 23.6% back to the ATL and 38.2% back to the 3/23/20 low. Provided they hold this area and get right back above the 200 day, look for a run at the high again, Failing to hold 110.00 should send it down to 38.2% and 61.8% of the same levels between 91.00 and 88.00.

FB
FB has traded on the 200 day average two separate times since the beginning of this year, once when it was at 247.00, it also held above the 242.00 major Gann square and 38.2% back to the 3/1/20 low, they also held this same area on 9/21/20. The second time they sat on it for three weeks at 259.00. The upside target on this rally is the 307.00 major Gann square that they fell just short of in August of last year and once they clear this look for the next major Gann square at 342.00. On a solid close below the 200 day average look for the area of 242.00 to 236.00, this is a major Gann square, 23.6% back to the ATL and 38.2% back to 3/18/20 low.

GOOGL
GOOGL is the strongest of them all and has held above 1975.00 for the last five weeks, this is 23.6% back to the 9/24/20 low. You can use this as the short term swing point, as long as it remains above it look for the 2210.00 major Gann square. Below 1975.00 look for 1876.00, this is 23.6% back to the 3/23/20 low.
