Grains, short term Fibs
ONE44 Analytics where the analysis is concise and to the point
Our goal is to not only give you actionable information, but to help you understand why we think this is happening based on pure price analysis with Fibonacci retracements, that we believe are the underlying structure of all markets and Gann squares.
For the ONE44 Fibonacci rules and guidelines to help with this article, go here.
Charts are courtesy of Barchart.com
Grains
This is an update of the short term Fibonacci retracements using the ONE44 rules and guidelines.
You can find the long term Fibonacci levels in the 11/2/21 update and as always you can find the Gann "Law of Vibration" charts for short term support and resistance updated each day here.
Soybeans
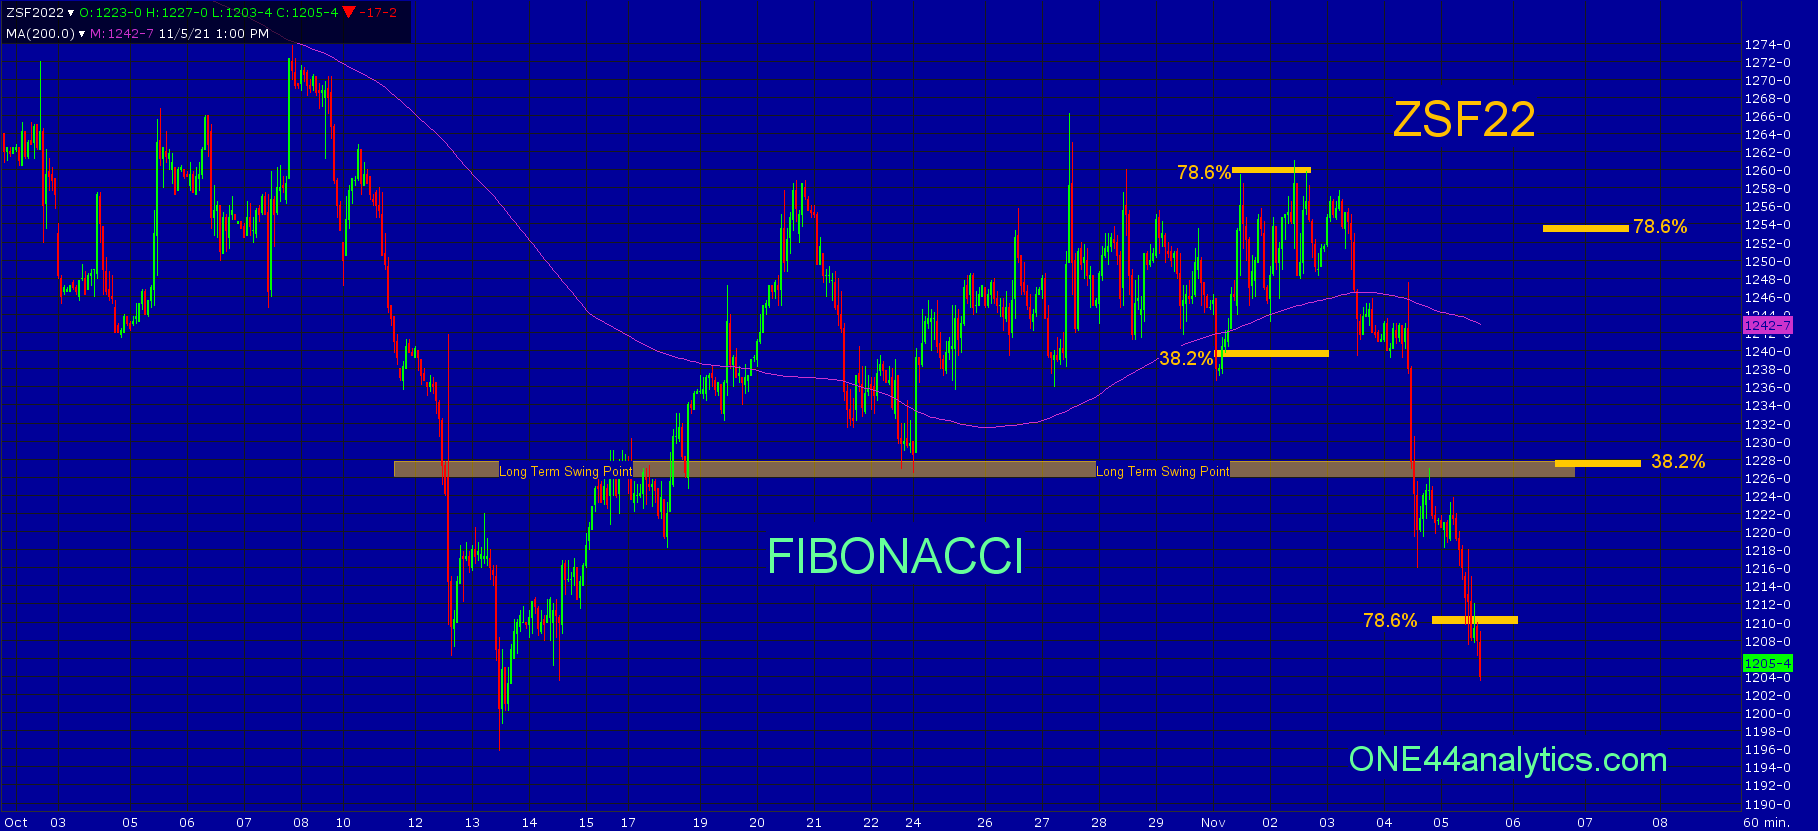
The break from 23.6% at 1263.00, was also set up by the 78.6% retracement up at 1260.00 on 11/2/21 after holding 38.2% at 1239.00 on 10/31/21. The failure to make a new high after holding 38.2% tells us to look for 61.8% of the same move and a break from 78.6% can be the end of the trend higher, per the ONE44 Fibonacci rules and guidelines. The break from 1260.00 has now taken it through the long term swing point of 1228.00 and down past the 78.6% retracement at 1210.00.
The things to watch for now are,
A close back above 1210.00 can send it up to 78.6% the other way at 1253.00, however any rally from there that does not get back above the 1228.00 long term swing point, which is also 38.2% back up to the 1266.25 high keeps the short term and long term negative. Staying below 1210.00, or failing from 1228.00 should send it down to 61.8% of the contract high and low at 1080.00.
Corn
Our last update was,
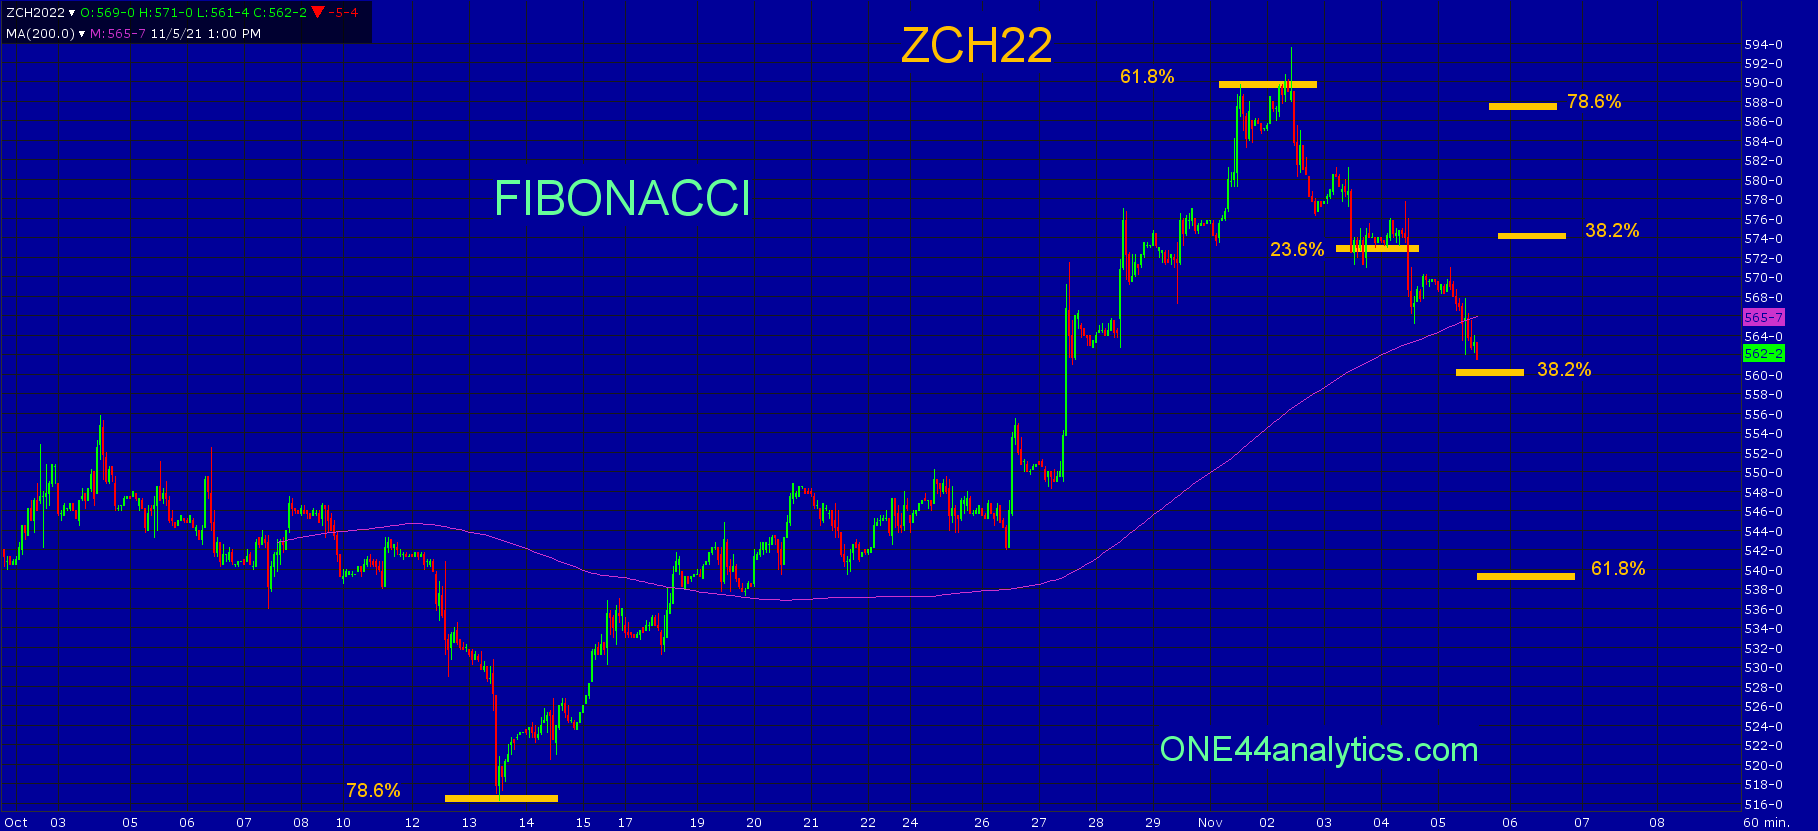
"Corn has now hit the 61.8% (585.00) target based on the guidelines mentioned above. Following the ONE44 Fibonacci 61.8% rule, we should be looking for a setback to 61.8% of where it just came from and this will be 540.00. As always we will watch all the retracements to see just how weak, or strong the market is, regardless of that target. Only being able to get to 38.2% at 561.00 would keep the short term trend positive and you can look for 78.6% above at 612.00."
Currently,
The break from 589.00 (61.8% March contract) has now taken it down to just above 38.2%, this is 560.50. Even though the target from 61.8% is 61.8% the other way at 539.50, we watch all the retracements to see just how weak and strong the market is. Holding 38.2% will keep the short term positive and should send it to new highs for the move. Again watching all the retracements, only getting up to 38.2% at 574.00 would be a negative sign and a failure to make a new high, especially at 78.6% should send it down to the 61.8% target.
Wheat
In our last update we said,
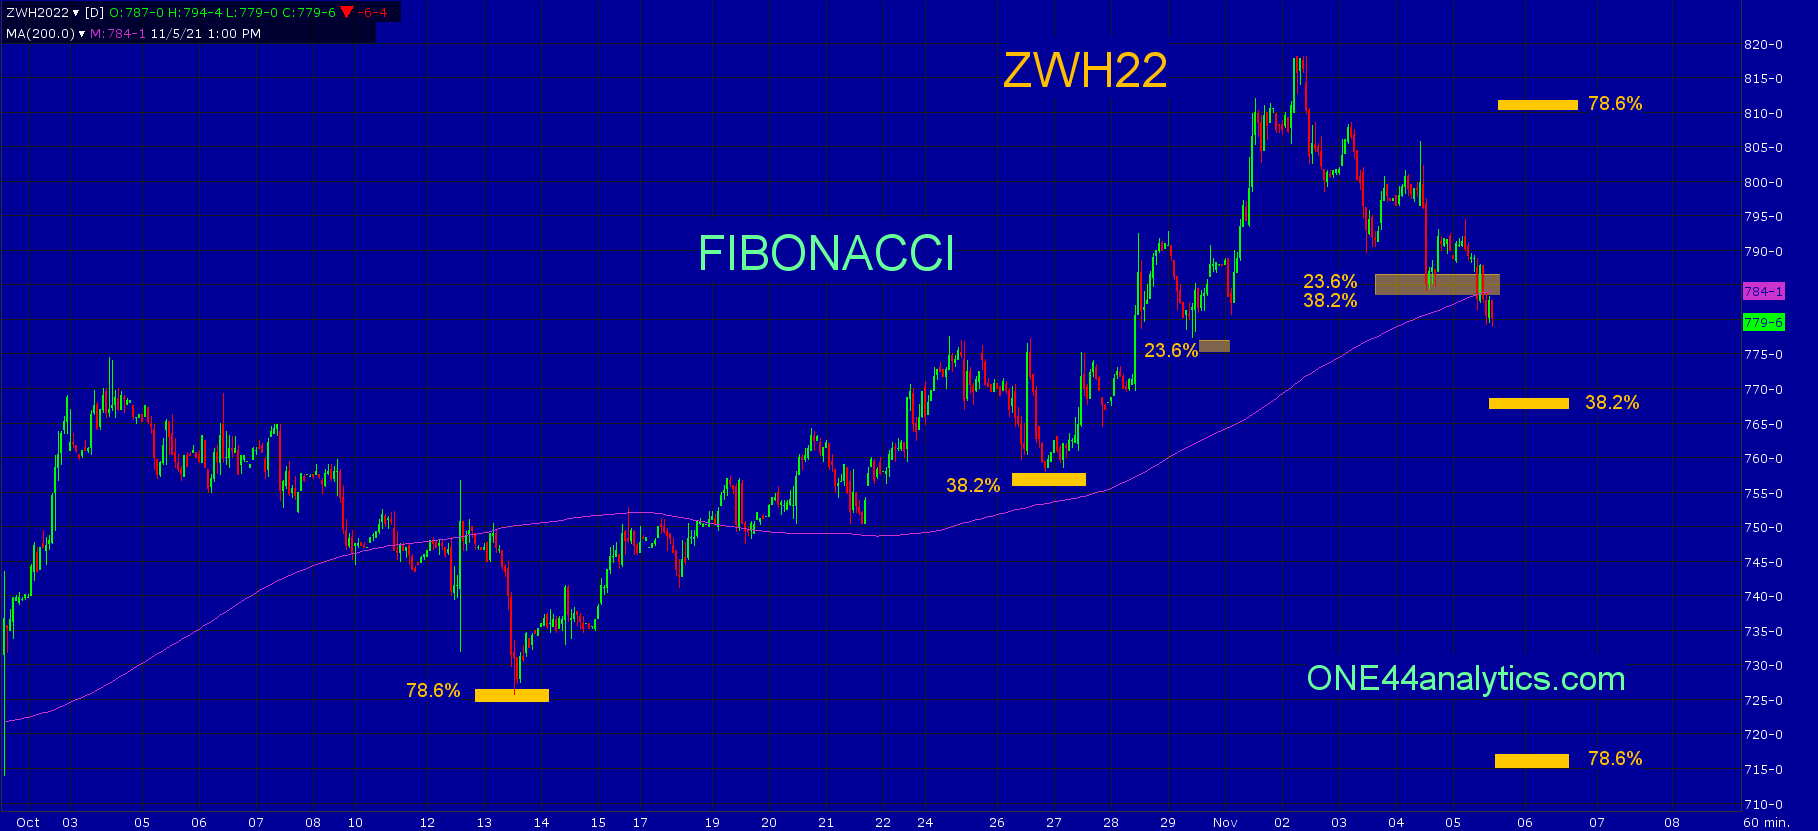
"The level that can set this market back is 78.6% to the 2012 high, this is 820.00. On any break from this area look for 748.00 to 745.00, this area is 38.2% back to the 7/9/21 low and 23.6% back to the 2020 low. Holding these levels will keep the long term trend extremely positive and you can look for the long term target of 960.00."
The close on Friday was below the 748.00 to 745.00 area and we are now looking for 38.2% at 769.00. Holding this level keeps the short term positive and we can look for new highs. Any rally that fails to make a new high and more importantly if that happens at 78.6% at 810.00 can put an end to the long term rally. Taking out 769.00 turns the short term trend negative and the target then becomes 78.6% at 717.00.
Sign up for our Free newsletter here.
FULL RISK DISCLOSURE: Futures trading contains substantial risk and is not for every investor. An investor could potentially lose all or more than the initial investment. Commission Rule 4.41(b)(1)(I) hypothetical or simulated performance results have certain inherent limitations. Unlike an actual performance record, simulated results do not represent actual trading. Also, since the trades have not actually been executed, the results may have under- or over-compensated for the impact, if any, of certain market factors, such as lack of liquidity. Simulated trading programs in general are also subject to the fact that they are designed with the benefit of hindsight. No representation is being made that any account will or is likely to achieve profits or losses similar to those shown. Past performance is not necessarily indicative of future results.