Key levels for Grains updated
ONE44 Analytics where the analysis is concise and to the point
Our goal is to not only give you actionable information, but to help you understand why we think this is happening based on pure price analysis with Fibonacci retracements, that we believe are the underlying structure of all markets and Gann squares.
For the ONE44 Fibonacci rules and guidelines to help with this article, go here.
Charts are courtesy of Barchart.com
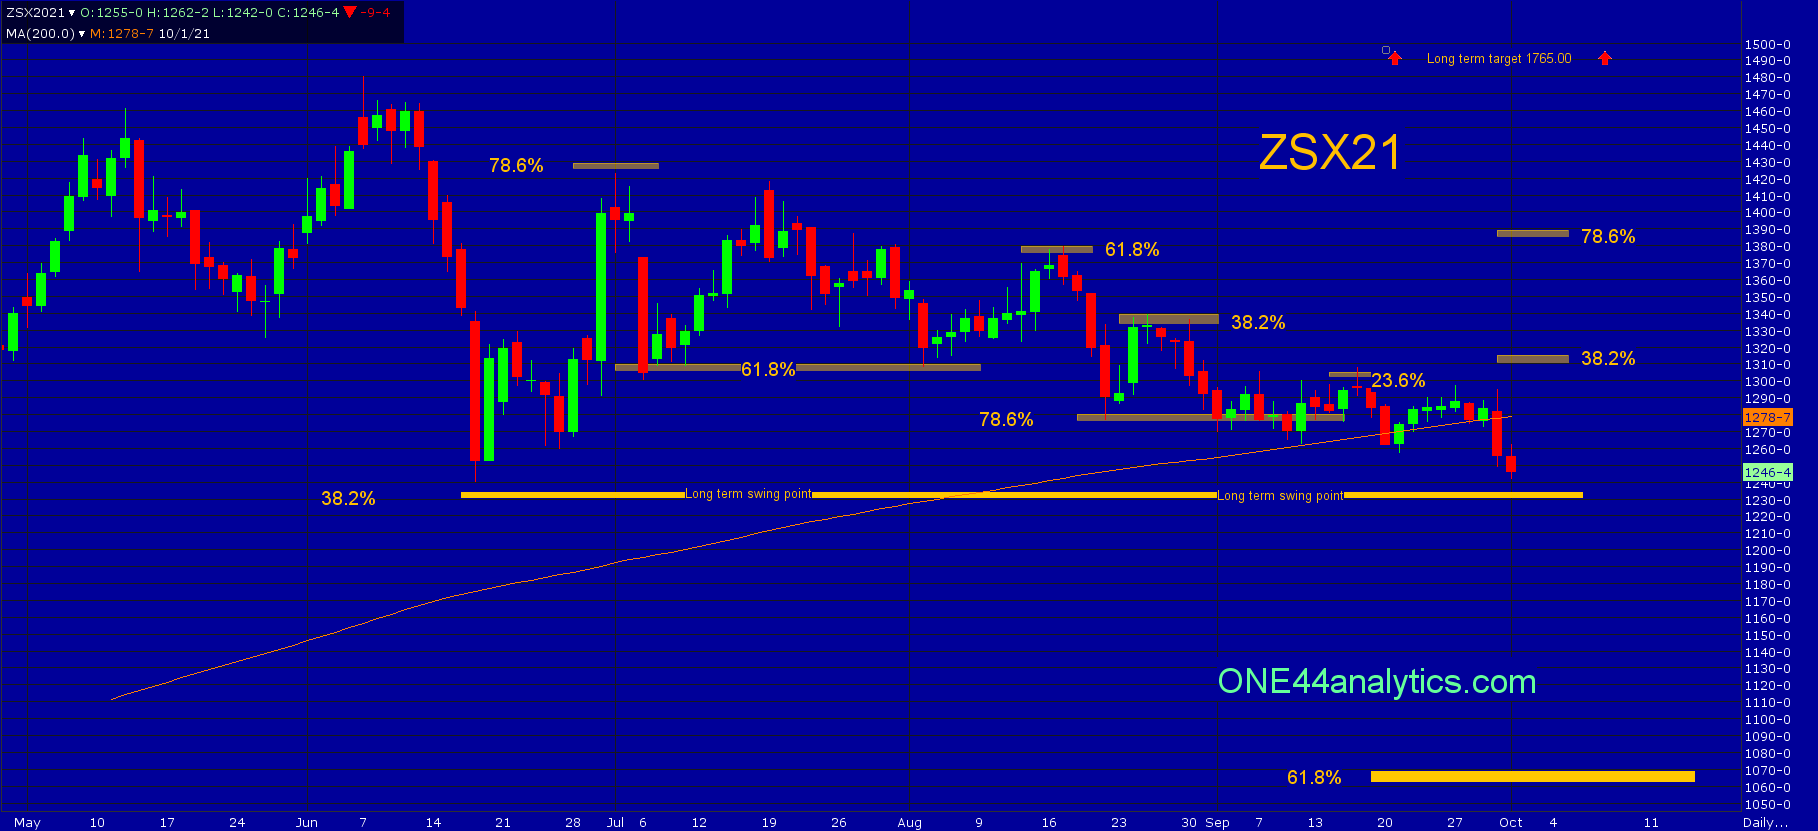
Soybeans
The long term trend is positive as long as it stays above 1235.00, this is 38.2% of the contract high and the 2020 low. Using the ONE44 Fibonacci 38.2% rule the long term target is new contract highs and then 1765.00. A failure to hold 1235.00 should send it down to 61.8% at 1065.00.
The short term trend is still down, this started on 7/1/21 at the 78.6% retracement and as you can see on the chart, each rally has hit a retracement to keep it negative. This will be the case until it can take out 38.2% of the current down move at 1311.50. Once they have done this look for 78.6% at 1386.00, beyond this we look to the long term levels. A failure to get above 1311.50 should send it down to the long term swing point of 1235.00.
Currently,
We are now watching for the long term swing point at 1235.00, it can trade below it, however we would not want to see more than one close below. Provided they can hold this area we will first look to 38.2% of the move down, once they take this out it will turn the short term positive again and you can look for 78.6%. Failing to hold 1235.00 (38.2%) it should send it down to 61.8% at 1070.00.
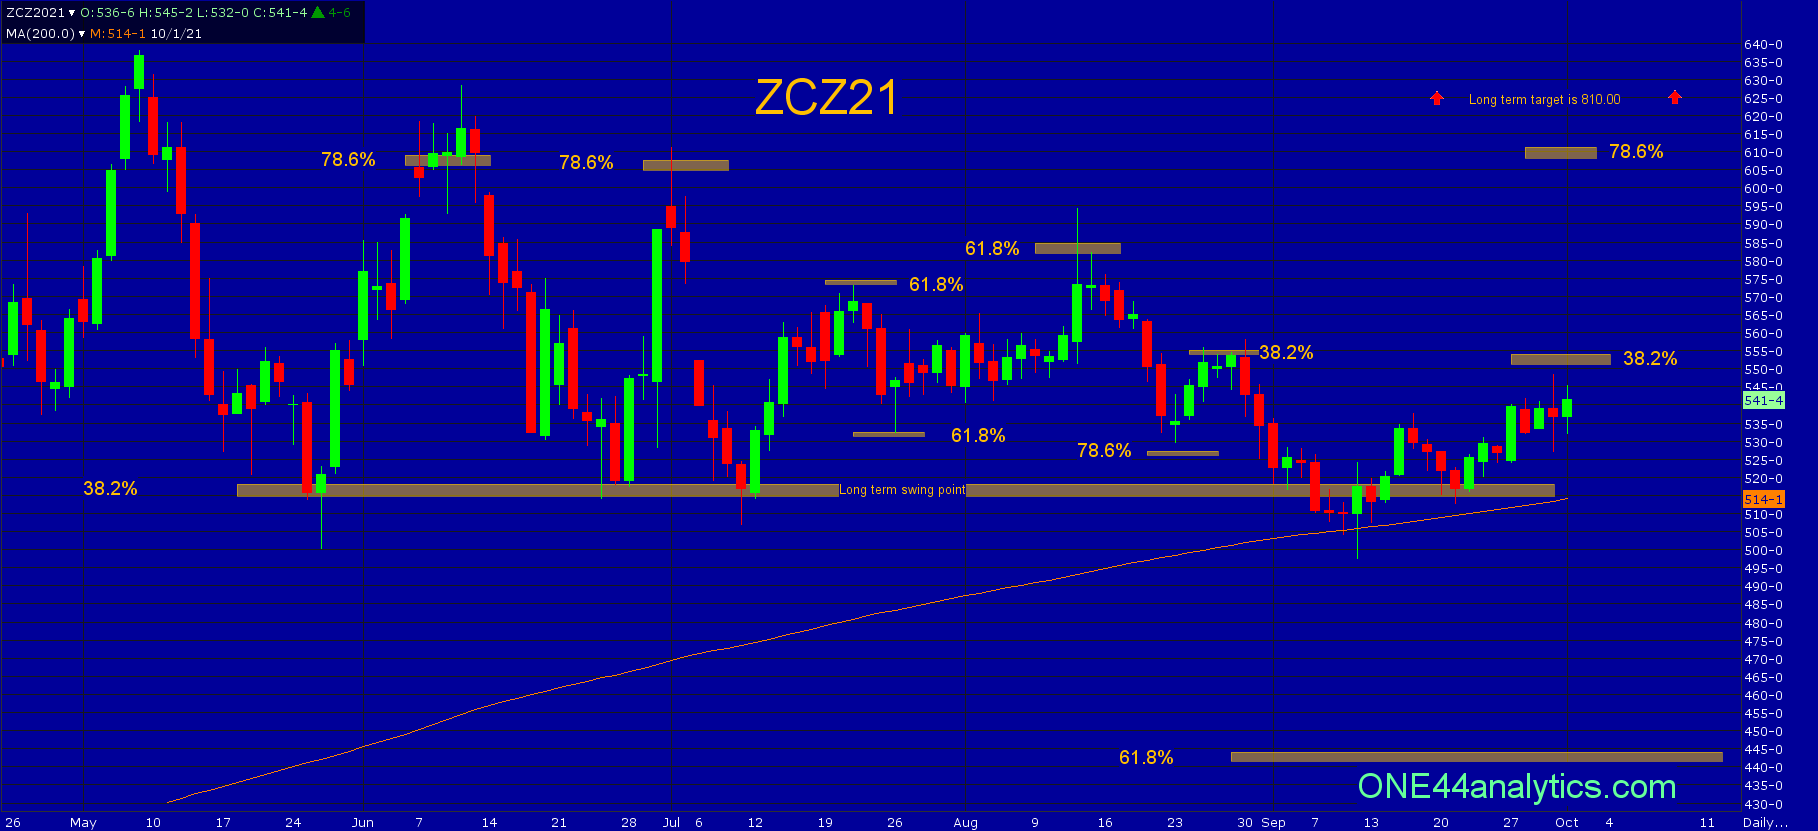
Corn
Everything here remains the same...
Corn has been holding the long term swing point of 518.00 since May, with one exception this month where it had a few closes below it, but never closed below the 200 day moving average. It retested it on 9/21/21 and as long as it can continue to close above it the long term trend is still positive and like the Soybeans you can look for new contract highs and then the long term target of 810.00.
The short term trend is down, this started on 6/10/21 when it failed to make a new contract high after holding the 518.00 long term swing point. This will not change until they can take out 38.2% at 551.00. Provided they do, look for 78.6% up at 609.00. Failing to get above 551.00 should send it back to the long term swing point of 518.00. Taking out 518.00 should send it to 61.8% at 445.00.
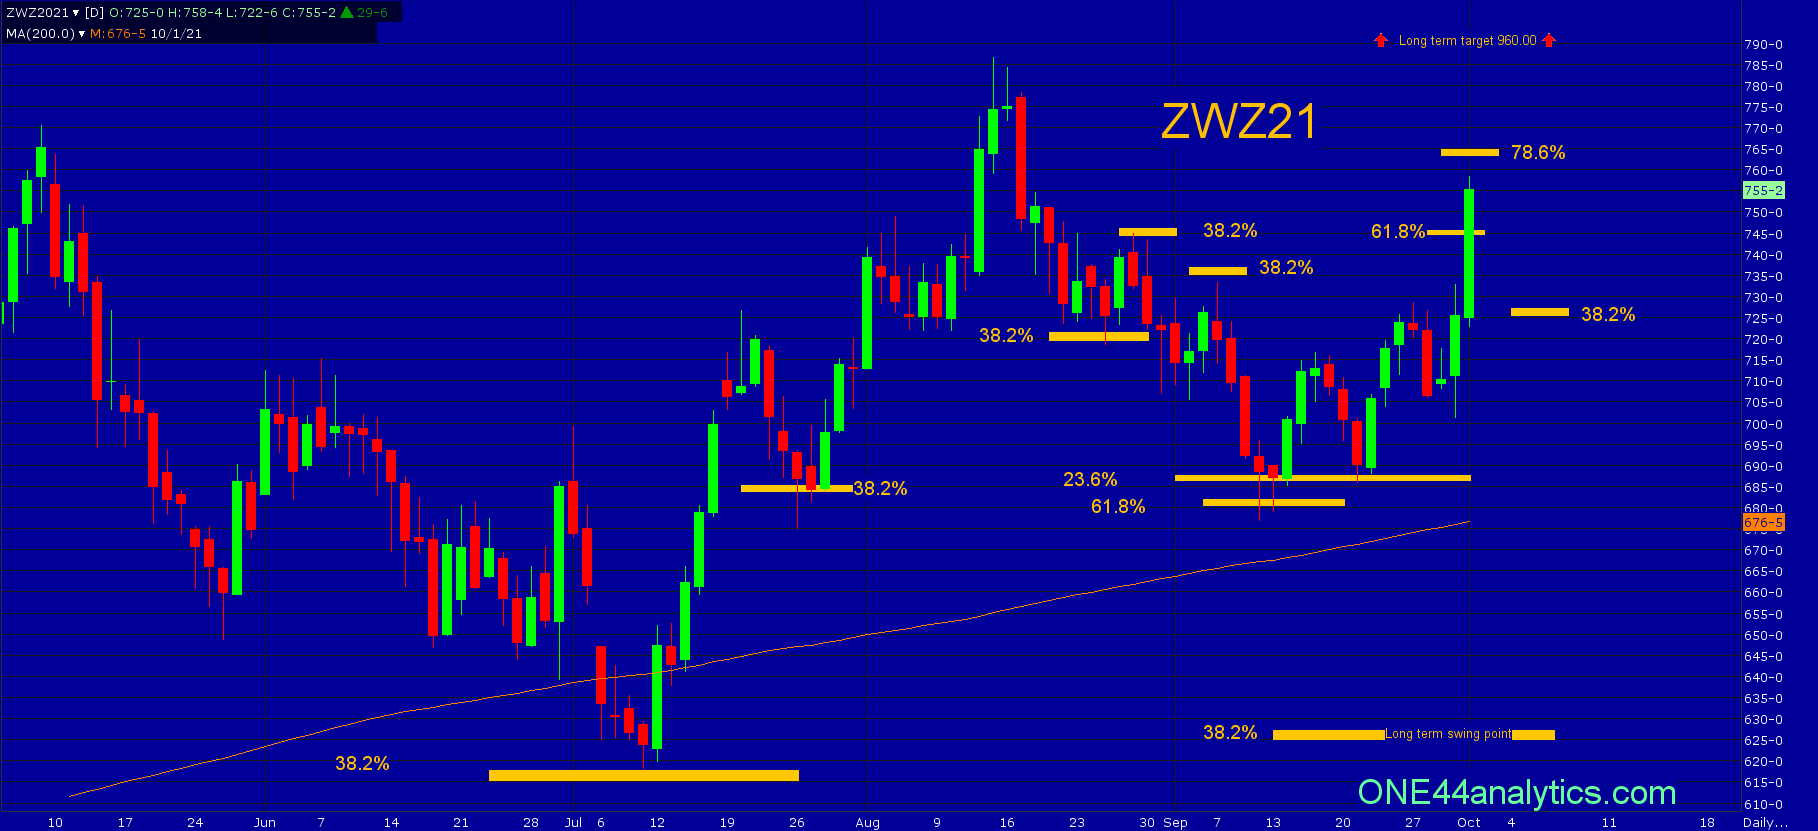
Wheat
Wheat is the strongest of the 3 markets, it hit the long term swing point of 618.00 in July and did go on to make new contract highs. The recent low on 9/10/21 hit 23.6% of the contract high and the 2020 low and 61.8% back of the high to the 7/9/21 low. The 23.6% rule tells us to look for new highs after holding it and the 61.8% rule says to look for 61.8% of where it just came from and this is 745.00.
In the short term we are looking for 745.00. In the long term, new highs and then 960.00.
Currently,
The 745.00 target from the 61.8% rule was met and exceeded. Short term our next resistance is 78.6% at 763.00 and as long as it stays above 38.2% (727.00) of the current rally the short term trend remains positive.
Check out our FREE Gann Law of Vibration Charts for short term support and resistance here.
Sign up for our Free newsletter here
FULL RISK DISCLOSURE: Futures trading contains substantial risk and is not for every investor. An investor could potentially lose all or more than the initial investment. Commission Rule 4.41(b)(1)(I) hypothetical or simulated performance results have certain inherent limitations. Unlike an actual performance record, simulated results do not represent actual trading. Also, since the trades have not actually been executed, the results may have under- or over-compensated for the impact, if any, of certain market factors, such as lack of liquidity. Simulated trading programs in general are also subject to the fact that they are designed with the benefit of hindsight. No representation is being made that any account will or is likely to achieve profits or losses similar to those shown. Past performance is not necessarily indicative of future results.