NASDAQ 100 and the break from 61.8%

NASDAQ 100
This is an ongoing update to where the market has been and is now going. We highly recommend that you go back and read all the past posts, so you can see why we are, where we are and all posted ahead of the turns in the trend.
From the 3/29/22 post,
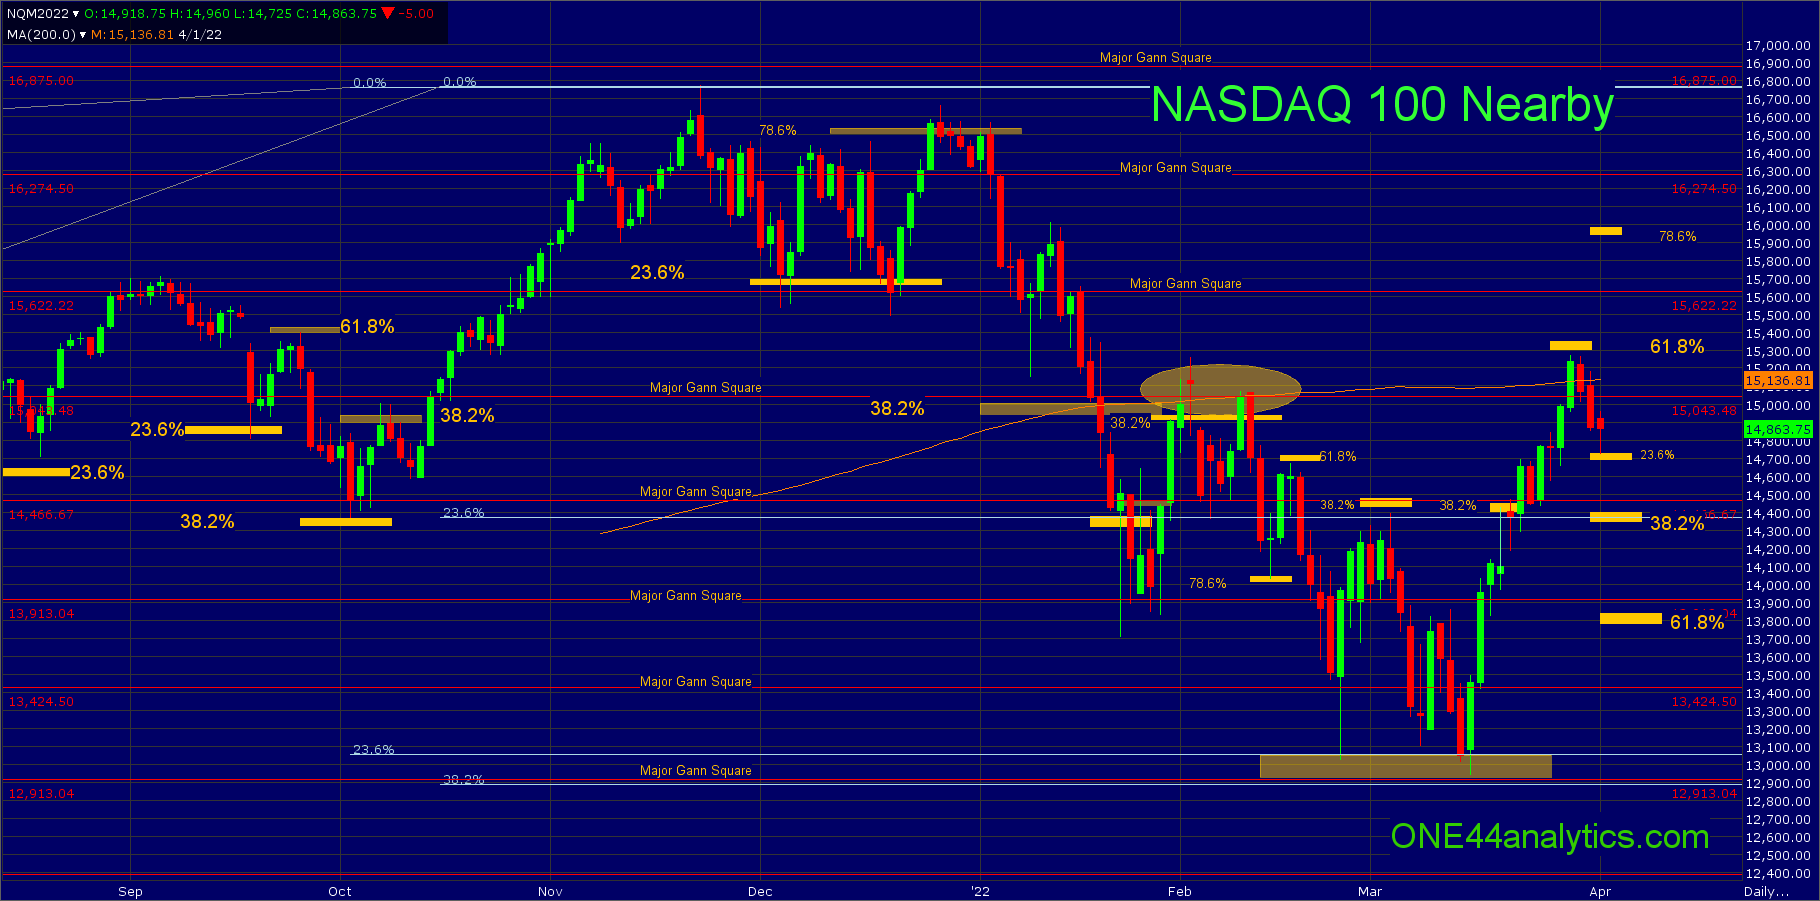
Most importantly we have to keep in mind that the low was the combination of 23.6% back to the 2008 low and 38.2% back to the March 2020 low and following the ONE44 Fibonacci rules, a new ATH is the long term target. As we always say you have to watch all the retracements to see just how strong, or weak the market is regardless of the long term target. So, now that the rally from the 3/15/22 low hit the upside target of 61.8% (today's high 15,268) based on already reacting to 38.2% (14,400) we have to bring in the 61.8% rule, this is,
Whenever the market holds 61.8% of a move, look for it to go 61.8% of where it just came from. This usually happens when a market is directionless, or in a consolidation period.
Even with it falling just short of 15,300 the reaction should be the same as if it hit it and that is 61.8% the other way at 13,850, It can still trade above 15,300, but the close is what matters. Watching all the retracements on any break, only getting back to 38.2% of the rally at 14,400 would keep the short and long term trend positive and you can look for new highs for the move. We would like to see a close back below the 200 day average at 15,123 and the 15,043 major Gann square confirm a move lower. With a solid close above 15,300 look for 78.6% of the same move at 15,900.
Currently,
The break from 15,300 (61.8%) has now taken it to 23.6% of the recent rally at 14,725, if this is all it can break the trend remains extremely positive and you can look for a retest of the 15,268 high to start. The longer term target is still 61.8% at 13,850 based on the ONE44 61.8% rule. On a continued break from 61.8% look for 38.2% at 14,400, this is the short term swing point that it needs to hold to keep the trend positive. Below it, look for the 61.8% target. There are also major Gann squares that come in at 14,466 and 13,913; these are both right near 38.2% and 61.8% giving the areas added support.
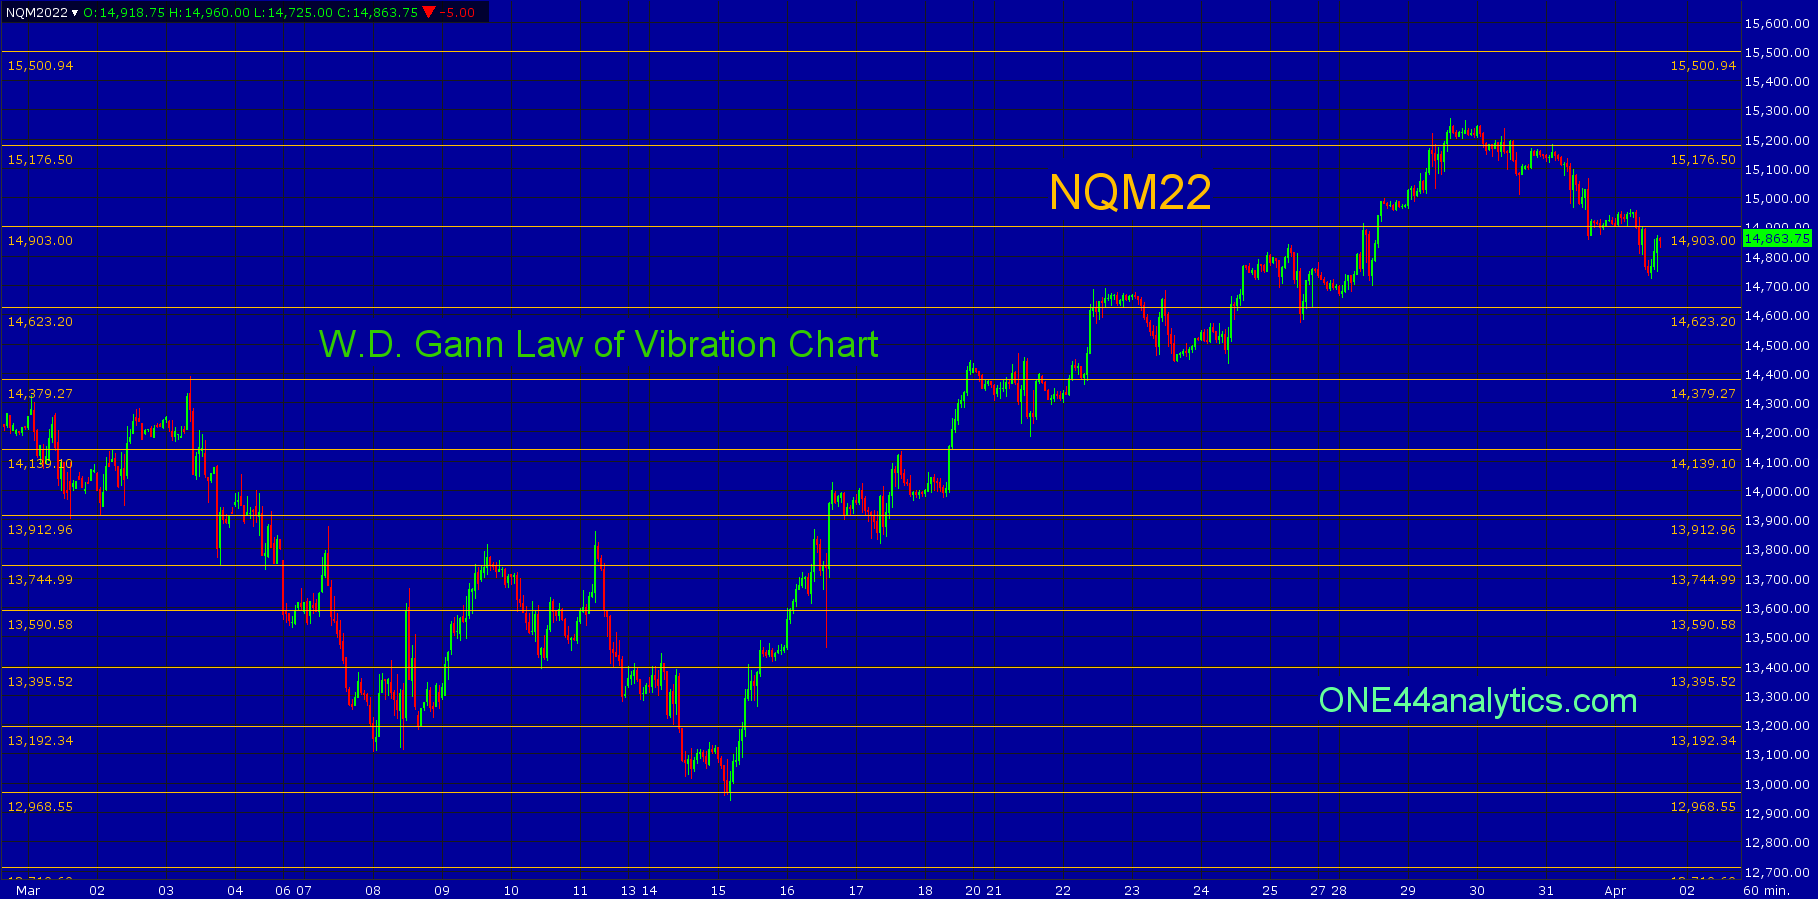
You can also use the Gann Law of Vibration chart for short term support and resistance, chart below.
Sign up for our Free newsletter here.