Tesla, retracements within retracements and 38.2%

Tesla
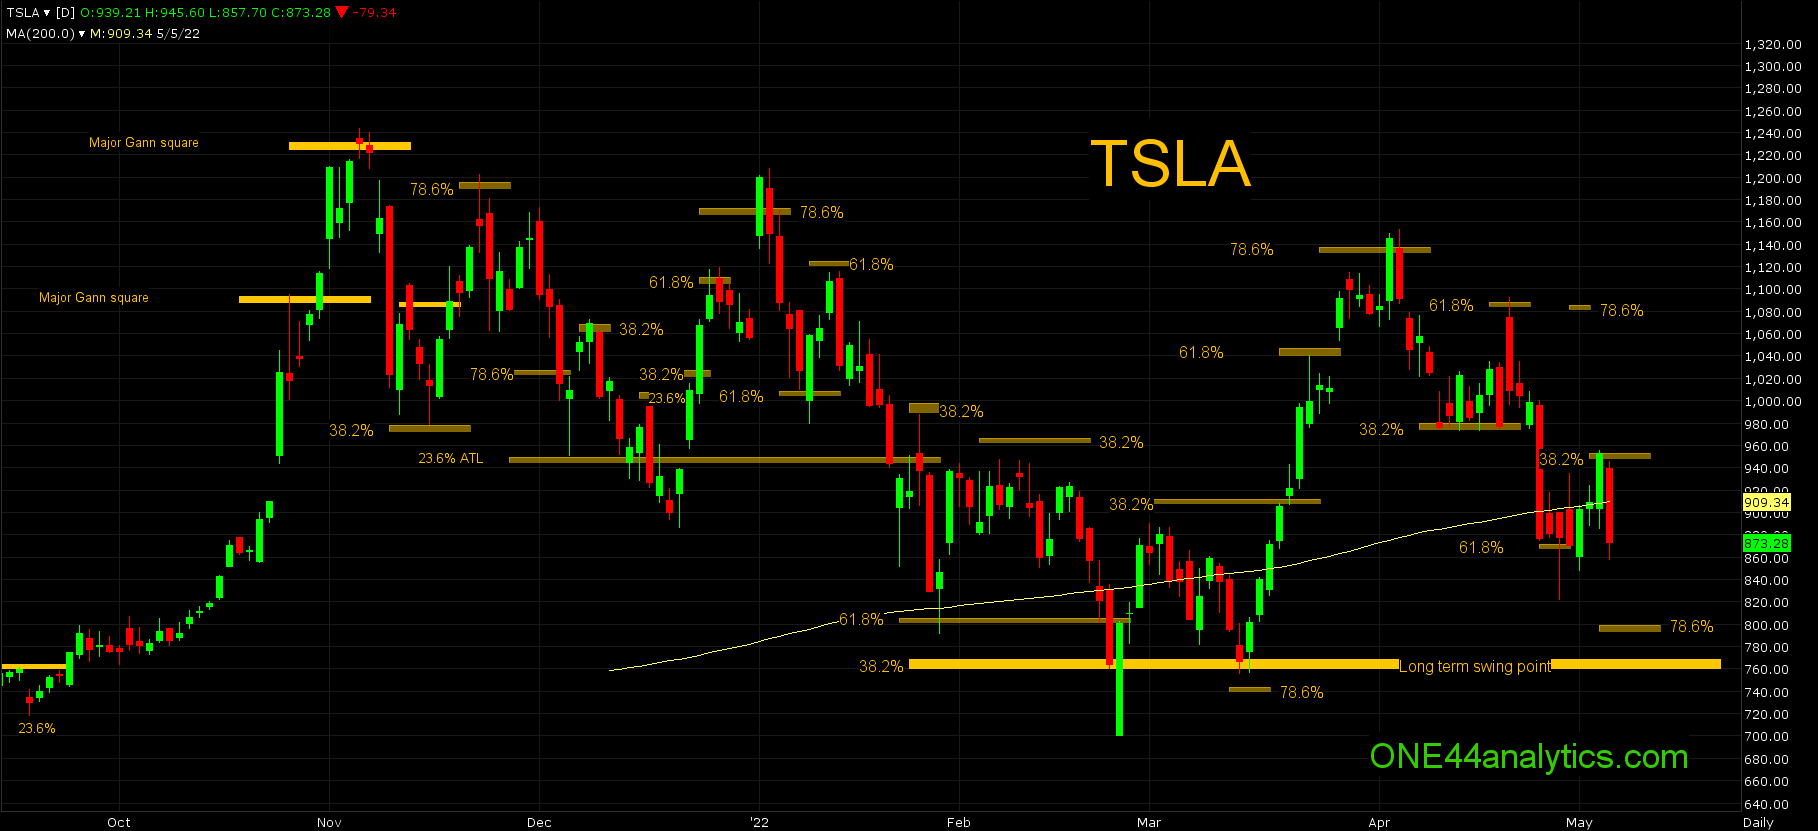
Tesla is a very good example of retracements within retracements and how the long term says one thing, but the reactions from shorter term retracements say another. There will always be short term trends in between long term trends and that is why we always say, " we watch all the retracements on every move to see just how weak, or strong the market is regardless of the longer term target".
In the big picture the low on 2/24/22 held the long term swing point of 765.00, this was 38.2% of the ATH and ATL, it did trade well below it, however more importantly it closed back above it. Following the ONE44 38.2% rule, we know that a new high is possible, as we said, that's the BIG picture.
As you can see on the chart it fell short of 38.2% back to the ATH on 3/1/22, the setback from there took it back to the long term swing point on 3/14/22 and then a massive rally followed, (you can go back on our posts to see just how we called this). The rally ripped through 38.2%, 61.8% and then finally stopped at 78.6% at 1135.00.
This is where the counter moves starts. When we follow the ONE44 78.6% rule we know 78.6% the other way is possible and this is 800.00. Now as we watch all the retracements on the setback from 1135.00, it holds 38.2% at 978.00, by holding this level it tells us a new high for the move is possible and on a failure to hold it look for 61.8% at 871.00.
The rally from 978.00 not only failed to make a new high, but it stopped at 61.8% back up on 4/21/22 at 1085.00, the move down from here took it to the 61.8% target of 871.00 and more, however it never closed below it and we can start to watch the retracements above to see just how strong the reaction from the low is.
The rally quickly ended at 38.2% at 951.00, keeping the short term trend negative and being 38.2% you can look for new lows. A new low would get into the target area of 78.6% at 800.00 to complete the 78.6% on 4/4/22 to 78.6%.
Again all of this action does not change the long term trend until the long term swing point of 765.00 (38.2% of ATH and ATL) is taken out.
Sign up for our Free newsletter here.
FULL RISK DISCLOSURE: Futures trading contains substantial risk and is not for every investor. An investor could potentially lose all or more than the initial investment. Commission Rule 4.41(b)(1)(I) hypothetical or simulated performance results have certain inherent limitations. Unlike an actual performance record, simulated results do not represent actual trading. Also, since the trades have not actually been executed, the results may have under- or over-compensated for the impact, if any, of certain market factors, such as lack of liquidity. Simulated trading programs in general are also subject to the fact that they are designed with the benefit of hindsight. No representation is being made that any account will or is likely to achieve profits or losses similar to those shown. Past performance is not necessarily indicative of future results.