The long and short of Corn
Educational and Actionable information using Fibonacci
ONE44 Analytics where the analysis is concise and to the point
Our goal is to not only give you actionable information, but to help you understand why we think this is happening based on pure price analysis with Fibonacci retracements, that we believe are the underlying structure of all markets and Gann squares.
Here is a quick set of guidelines for the Fibonacci retracements to help with this article. You can find all the rules/guidelines and examples on any deviations from these four basic rules on our website.
1) The Golden rule, any market that is going to continue the current trend must hold 38.2% and a new high/low should follow.
2) Markets that are extremely strong/weak will only go 23.6% and a new high/low should follow. Typically a runaway market.
3) The 61.8% rule is, any market that holds 61.8% should go 61.8% of where it just came from. Usual happens when a market is directionless, or in a consolidation period.
4) The 78.6% rule is, any market that holds 78.6% should go 78.6% of where it just came from. This is also where a lot of Bull markets end and start.
Charts are courtesy of Barchart.com
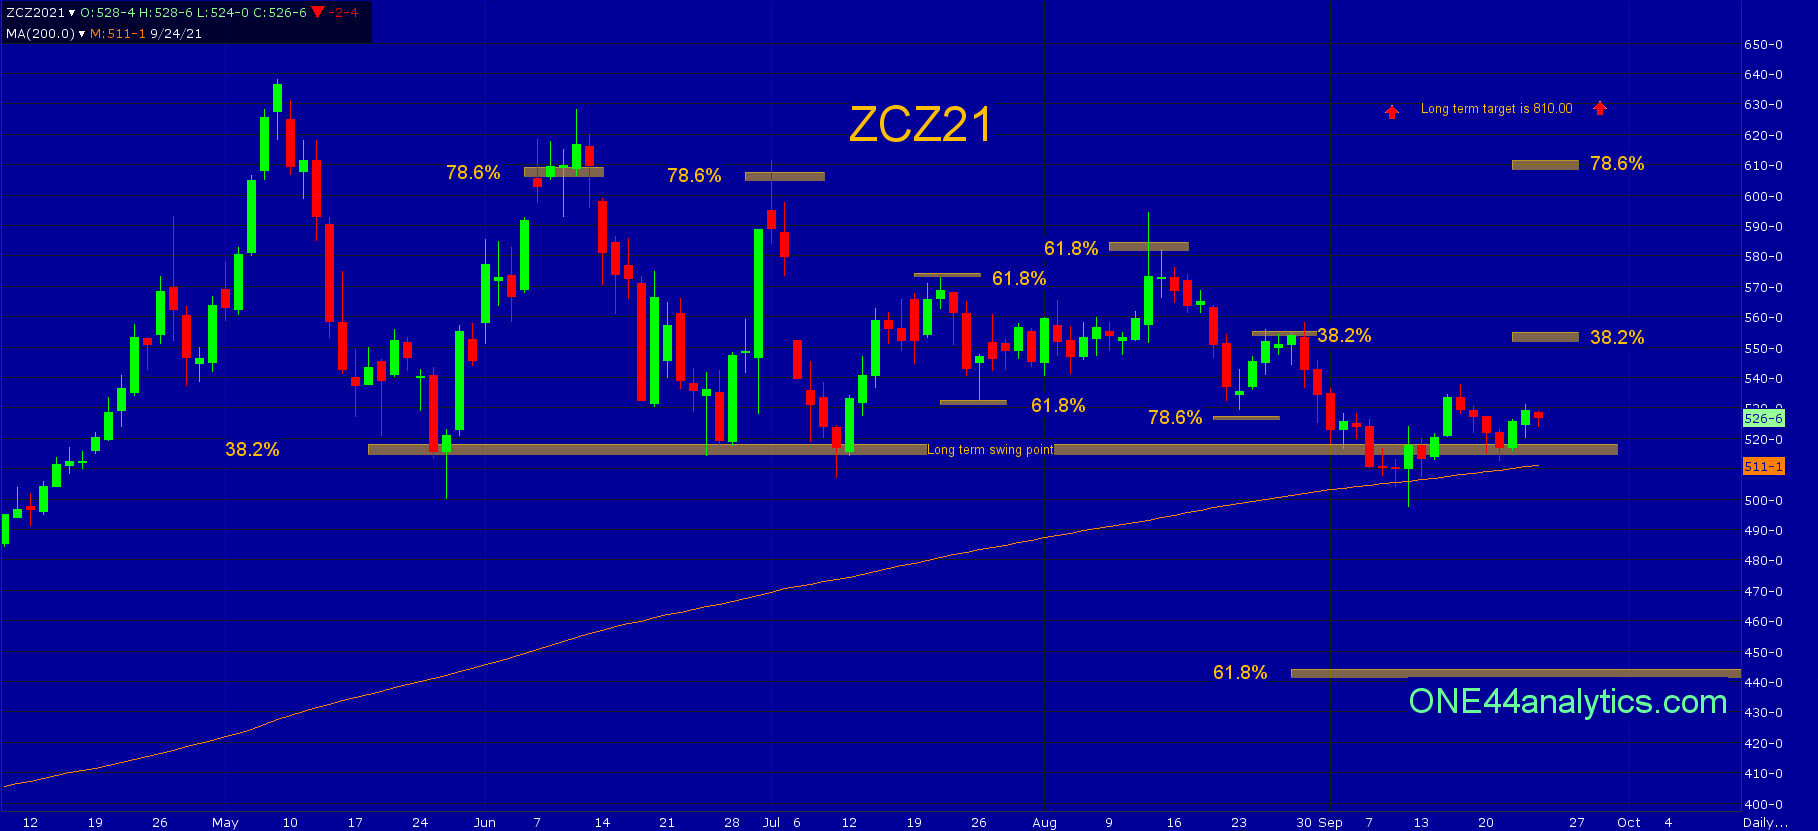
The long and short of Corn
Starting with the long term trend, Corn has been holding 38.2% of the contract high and low, this is 518.00 and it is our long term swing point. As you can see on the chart it has hit there 5 different times, once in May, June, July and twice in September. The first time in September it traded below and had a few closes under it, but as we said in the 9/16/21 update,
After trading below the long term swing point of 518.00 and then holding the 200 day moving average at 504.00 on a closing basis, it is now back above the long term swing point.
By holding this area the long term target is new highs for the year, however as we always say we have to watch all the retracements on every move to see just how strong, or weak the market is. It is currently at 38.2% of the move down, this is 534.50 and it is the short term swing point.
This week's low retested the long term swing point and as stated on 9/16/21 holding this level should send them to new highs for the year long term and eventually to the long term target of 810.00.
Short term
Even with holding the long term swing point, it still has to take out 38.2% of the down trend started on 6/10/21. This level is 550.00, provided they can look for 78.6% up at 608.00. If all it can rally is up to 38.2% the short term trend remains negative and you can look for the long term swing point again. Closing below the long term swing point and the 200 day at 511.00 should send it down to 61.8% at 445.00.
You can get our short term support/resistance Fibonacci and Gann Law of Vibration charts for Free on our website under "Grains" at the top of the page. They are updated each day.
We are looking for your input, if there is a stock, or futures market you would like to see us do Fibonacci analysis on, email the ticker symbol to [email protected]
We will update these on the ONE44 website along with posting them on Barchart.com
Sign up for our Free newsletter here.
FULL RISK DISCLOSURE: Futures trading contains substantial risk and is not for every investor. An investor could potentially lose all or more than the initial investment. Commission Rule 4.41(b)(1)(I) hypothetical or simulated performance results have certain inherent limitations. Unlike an actual performance record, simulated results do not represent actual trading. Also, since the trades have not actually been executed, the results may have under- or over-compensated for the impact, if any, of certain market factors, such as lack of liquidity. Simulated trading programs in general are also subject to the fact that they are designed with the benefit of hindsight. No representation is being made that any account will or is likely to achieve profits or losses similar to those shown. Past performance is not necessarily indicative of future results.