Why we watch all the retracements, Ethereum
ONE44 Analytics where the analysis is concise and to the point
Our goal is to not only give you actionable information, but to help you understand why we think this is happening based on pure price analysis with Fibonacci retracements and Gann squares.
You can get all the rules and guidelines to the Fibonacci retracements on our website.
Ethereum
The current rally is a good example of why we always say, "We will watch all the retracements of all move regardless of what the long term targets are to see just how strong, or weak a market is" To see what gave us an upside target of 3360.00 after holding 1740.00 you can go back to this article.
To go over the latest rally we will use the same hourly chart in two parts to cover all the movements.
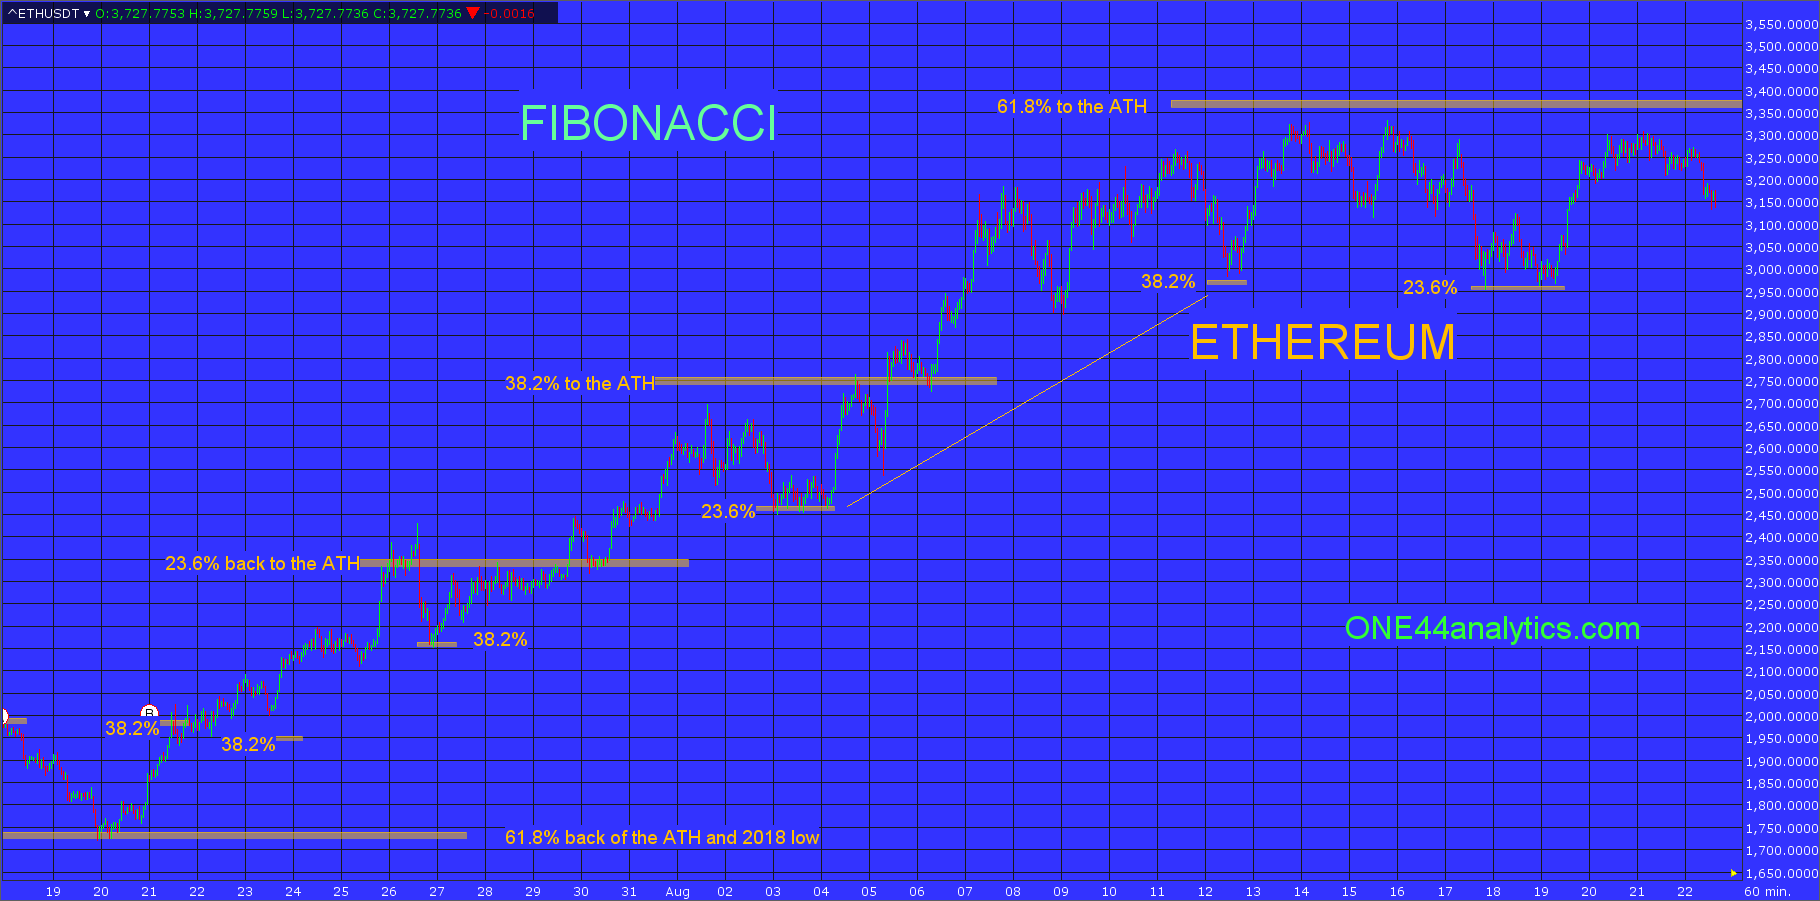
First chart
We will go back to when it held 1740.00 (61.8% of the ATH and 2018 low), the first rally took it to 23.6% to the ATH, this was 2350.00, it had a couple hourly closes above this level, but once it was back below it we would have been looking for new lows and this is the first example of why we watch all the retracements. The break from there could only get back to 38.2% at 2160.00, this was a very positive sign since a much bigger retracement said it should be going for new lows. A definite sign of a change in the trend. The rally from 38.2% sent it to new highs for the move as would be expected and kept the short term trend positive.
The setback on 8/3/21 came from just below 38.2% of the ATH, this was 2740.00, this break held 23.6% at 2460.00, telling you the market was extremely strong despite the major retracement above. When it did hit 2740.00 on 8/4/21 it could not even get back to 23.6% of the move, a very positive sign and that led to new highs for the move.
The next setback on 8/12/21 hit 38.2% to the low on 8/3/21, this was 3000.00. When a market is very strong it will only retrace to previous lows that are not the extreme as in this case. The rally from it took it to new highs for the move and just shy of the 3350.00 long term target of 61.8%. The break from this area held 23.6% of the whole move up at 2950.00. The rally from there did hit 3350.00 on 8/23/21. The break from it could not even get back to 23.6% of the move, showing a very strong market.
Next chart
The rally after failing to get back to 23.6% at 3000.00 took it to new highs and passed 61.8% back to the ATH. As we have mentioned in our previous posts the next target would be 78.6% at 3810.00. The long term swing point is now3000.00, this is 38.2% of the whole move up and any setback that can only go 23.6% at 3300.00 keeps the trend extremely positive. You can also watch retracemets back to the low on 8/17/21 to tighten up the support levels.
In the end this run up in Ethereum shows you how important it is to watch all the retracements regardless of the long term targets and which side of the market has greater control of the trend.

Sign up for our Free newsletter here.