Grains, the the levels they need to hold
ONE44 Analytics where the analysis is concise and to the point
Our goal is to not only give you actionable information, but to help you understand why we think this is happening based on pure price analysis with Fibonacci retracements, that we believe are the underlying structure of all markets and Gann squares.
Here is a quick set of guidelines for the Fibonacci retracements to help with this article. You can find all the rules/guidelines and examples on any deviations from these four basic rules on our website.
1) The Golden rule, any market that is going to continue the current trend must hold 38.2% and a new high/low should follow.
2) Markets that are extremely strong/weak will only go 23.6% and a new high/low should follow. Typically a runaway market.
3) The 61.8% rule is, any market that holds 61.8% should go 61.8% of where it just came from. Usual happens when a market is directionless, or in a consolidation period.
4) The 78.6% rule is, any market that holds 78.6% should go 78.6% of where it just came from. This is also where a lot of Bull markets end and start.
Grains
Corn ,Wheat and Soybeans all hit key support on Friday, Corn is at the level it needs to hold to keep the long term trend positive. Wheat is in the strongest position of the three and Soybeans are retesting the long term swing point.
Corn
In our last post we said...
9/7/21
Corn is at the crossroads.
Today's close was below the long term swing point of 518.00, this is 38.2% of the contract high and low. It has been here three other times, the first was on 5/25/21, the second on 6/24/21 and the third on 7/9/21. All of them produced big rallies. Following the ONE44 Fibonacci 38.2% rule, this is the level that must hold to keep the trend positive.
There still may be hope for the long side of the market. We always want to see two close's below a major retracement to consider it violated. Tomorrow's close will be key to see if the rally resumes, or they go for 61.8% at 445.00.
Here is what to look for, the 200 day moving average is at 504.50, if they trade down to it, or even through it and close back above 518.00 they may have dodged a bullet. With this happening, look for a rally back to 78.6% at 605.00, any rally from this area that only goes 38.2%, (this is currently 555.00 with today's low) would be a negative sign.
Provided it did get another lower close tomorrow, we would also want to see it close below the 200 day moving average at 504.5, if so, look for 61.8%. This would also put the idea we had back in the fall of 2020 that this was going to be a multi year rally on hold and that the next six months could be a wide trading range of 61.8% to 61.8%.
Today
Friday's action traded down to and through the 200 day moving average at 505.50 and then closed right on the long term swing point. Provided Friday's low holds and they can get a solid close above 518.00, you can look for a rally up to 78.6% at 600.00. With a solid close below 497.50 the next target is 61.8% at 443.00. This would then turn the long term trend negative and only a solid close back above 518.00 would change that.

Wheat
We ended our last post with...
9/9/21
There is a combination of retracements that can turn this market back up between 687.00 and 682.00, the first is 23.6% back to the contract low and the second is 61.8% back to the 7/9/21 low. Holding this area keeps the long term trend very positive and our long term target is 960.00. In the short term it will have to take out 38.2% back to the high to turn the short term positive, currently this level is 729.00.
Today
Friday's range hit both of these levels and closed back above 687.00 and as long as they can get another close above it, the trend remains extremely positive and you can look for 765.00 to start. Taking out the 677.00 low is negative, however we would want to see it also close below the 200 day moving average at 668.50 to give us the next target at the long term swing point of 626.00

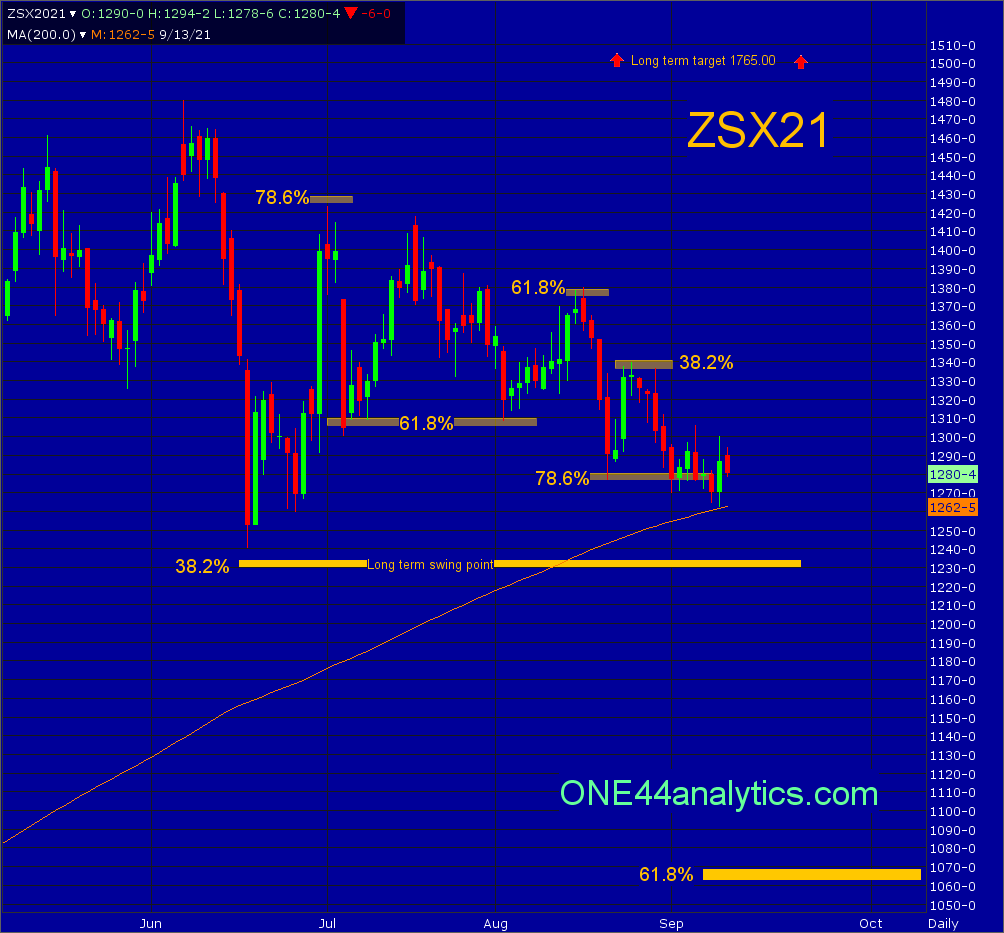
Soybeans
Everything in our last post remains the same..
8/30/21
The long term swing point remains 1235.00, this is 38.2% back of the contract high and low. The wide swings may continue, however as long as it continues to close above the long term swing point the long term target is 1765.00. With a couple solid closes below 1235.00 the long term trend turns negative and we will look for 61.8% at 1065.00.