Upside targets for Corn
ONE44 Analytics where the analysis is concise and to the point
Our goal is to not only give you actionable information, but to help you understand why we think this is happening based on pure price analysis with Fibonacci retracements, that we believe are the underlying structure of all markets and Gann squares.
For the ONE44 Fibonacci rules and guidelines to help with this article, go here.
Charts are courtesy of Barchart.com
Corn
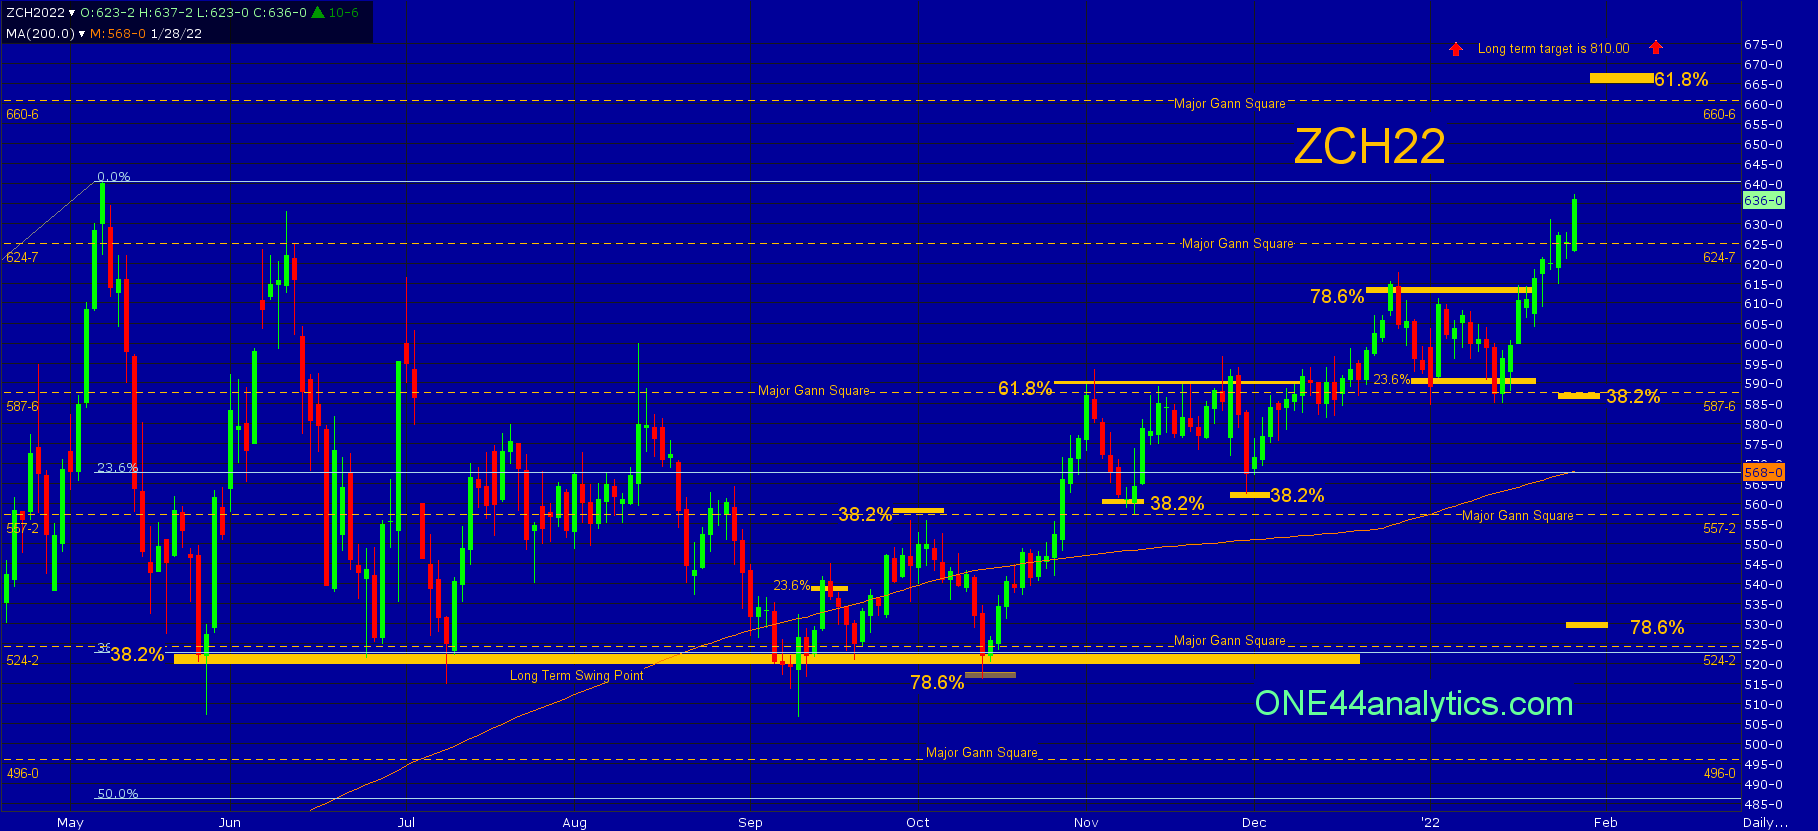
Taking a quick look at the rally that has taken place since it hit our long term swing point back in September at 522.00, you can see there were reactions from each of the retracements on this move. The chart below will help with all of this. The first rally hit 23.6% to the contract high on 9/15/21 and the setback from it was only able to get to the long term swing point again, this also was a major Gann square. The second rally hit 38.2% back on 9/30/21, along with the 557.00 major Gann square. The next setback was bigger and we should have been looking for new lows for the move based on the ONE44 Fibonacci rules and as you will see in the next couple rallies after this one, is why we watch all the retracements on every move to see just how weak, or strong the market is regardless of the longer term target.
The setback from the 9/30/21 high came back to the long term swing point, major Gann square at 524.00 and hit 78.6% back to the 9/10/21 low. As the 78.6% rule states, "hitting 78.6% should send it 78.6% the other way and is where a lot of Bull runs start and end." In this case you can see it started the next big rally and that took the market up to 61.8% on 11/1/21 and another major Gann square at 587.75. Now the 61.8% rule says to look for a 61.8% move the other way, however watching all the retracements we can see it could only get back to 38.2% on 11/8/21 and hit the 557.25 major Gann square. It had another setback from 61.8% on 11/24/21 that went right to 38.2% again on 11/30/21.
The rally from the 11/30/21 low hit 78.6% on 12/27/21 and the break could only go 23.6% back on 1/3/22 and again on 1/13/22. This also held the 587.75 major Gann square. The 23.6% rule states, "extremely strong, or weak markets will only go 23.6% back. This is typically a runaway market".
It has now taken out 78.6% and the 624.75 major Gann square and is about to make new contract highs. Just like we posted in the Soybean update we have to watch the Nearby chart as well now that March is the nearby contract and on it, they are approaching 61.8% back to the ATH, this is 667.00 and there is a major Gann square at 661.00, so this is our next target area.
You can use the 624.75 major Gann square as a swing point, above look for our target area and below it look for the short term swing point at 587.00, this is a major Gann square and 38.2% back to the 9/10/21 low.
Our long term target is 810.00 and as long as it stays above the long term swing point of 523.00 the idea of a multi-year rally is still intact that we first mentioned was possible in the fall of 2020.
We hope that you can see on the chart alone just how important the Fibonacci retracements and Gann squares are.
Sign up for our Free newsletter here.
If you are looking for option plays to go with the ONE44 levels, we highly recommend going to the Barchart webinar library where John Rowland has plenty of information on Option strategies.
Here is one, Using the Long Strangle Options Strategy for Opportunity Trades
FULL RISK DISCLOSURE: Futures trading contains substantial risk and is not for every investor. An investor could potentially lose all or more than the initial investment. Commission Rule 4.41(b)(1)(I) hypothetical or simulated performance results have certain inherent limitations. Unlike an actual performance record, simulated results do not represent actual trading. Also, since the trades have not actually been executed, the results may have under- or over-compensated for the impact, if any, of certain market factors, such as lack of liquidity. Simulated trading programs in general are also subject to the fact that they are designed with the benefit of hindsight. No representation is being made that any account will or is likely to achieve profits or losses similar to those shown. Past performance is not necessarily indicative of future results.