Bitcoin Ethereum update
ONE44 Analytics where the analysis is concise and to the point
Our goal is to not only give you actionable information, but to help you understand why we think this is happening based on pure price analysis with Fibonacci retracements, that we believe are the underlying structure of all markets and Gann squares.
For the ONE44 Fibonacci rules and guidelines to help with this article, go here.
Charts are courtesy of Barchart.com
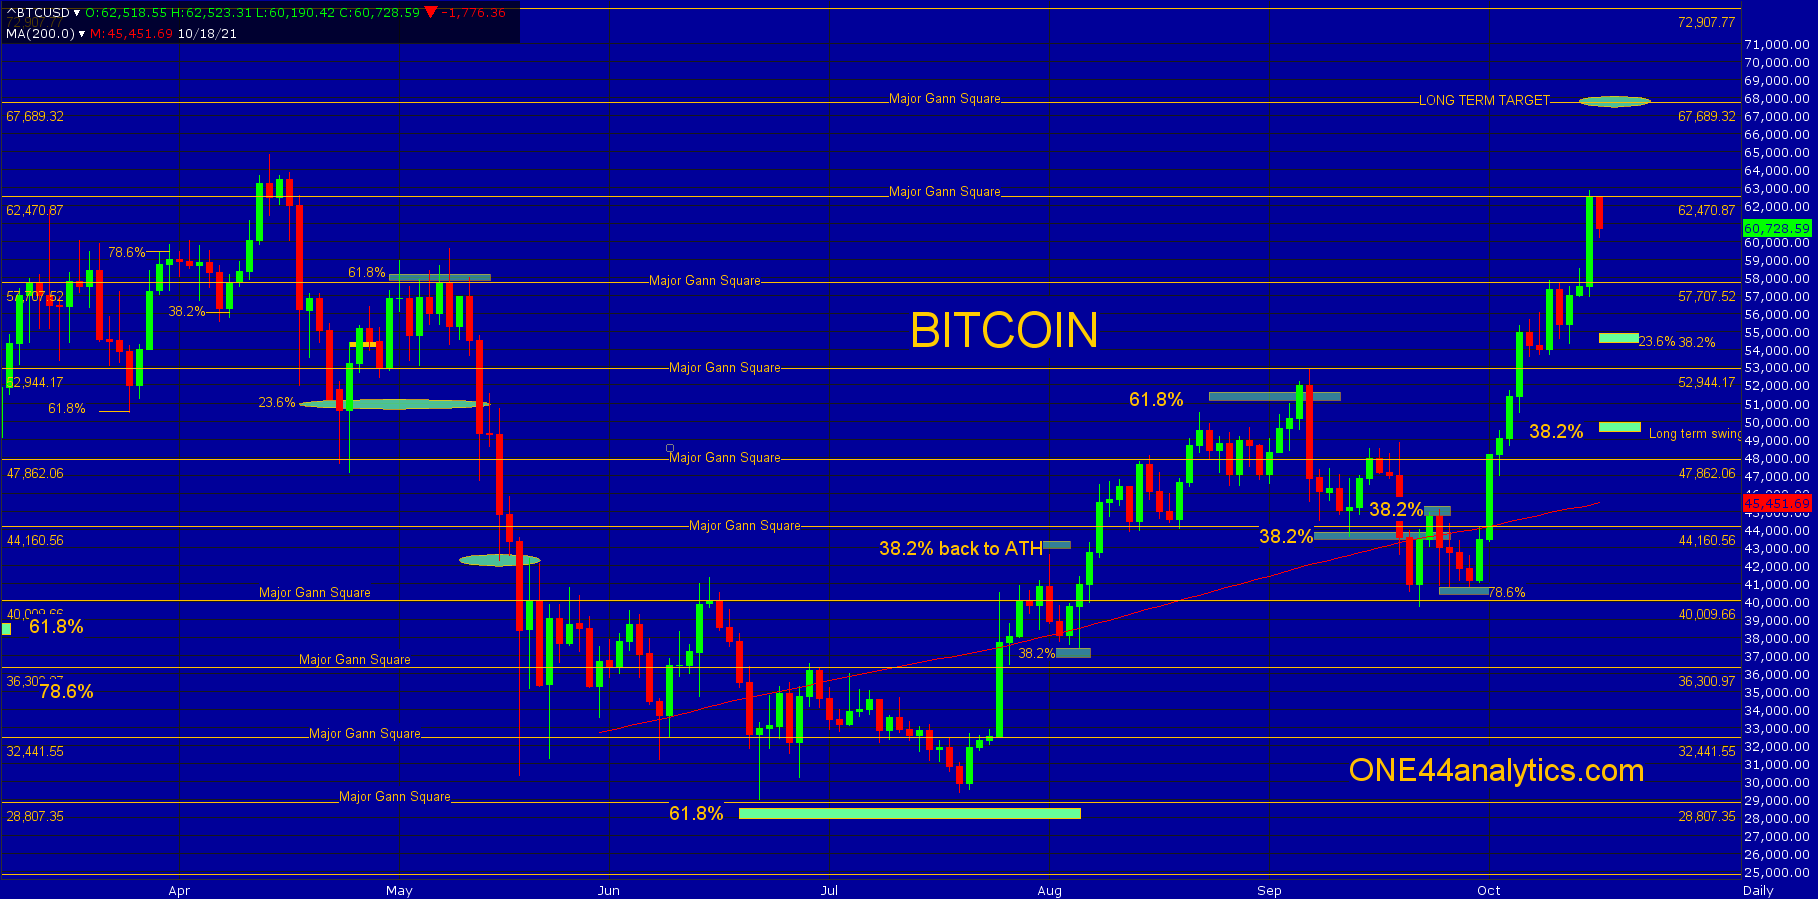
Bitcoin
Bitcoin stopped at the area of 57,150 to 57,700 for four days, but had no measurable setback. The rally through this area took it to the next major Gann square up at 62,470. Based on the Gann squares look for a setback to the previous one at 57,700 and above 62,470 look for the long term target of 67,689, also a major Gann square. Using Fibonacci retracements, there is nothing above for targets, on any break look for the area of 54,900 to 54,400, the first is 23.6% back to the 6/22/21 low and the second is 38.2% back to the 9/22/21 low. The long term swing point has now moved up to 49,900. Just for reference, a close above the long term target of 67,689 will give us a new long term target of 89,770.
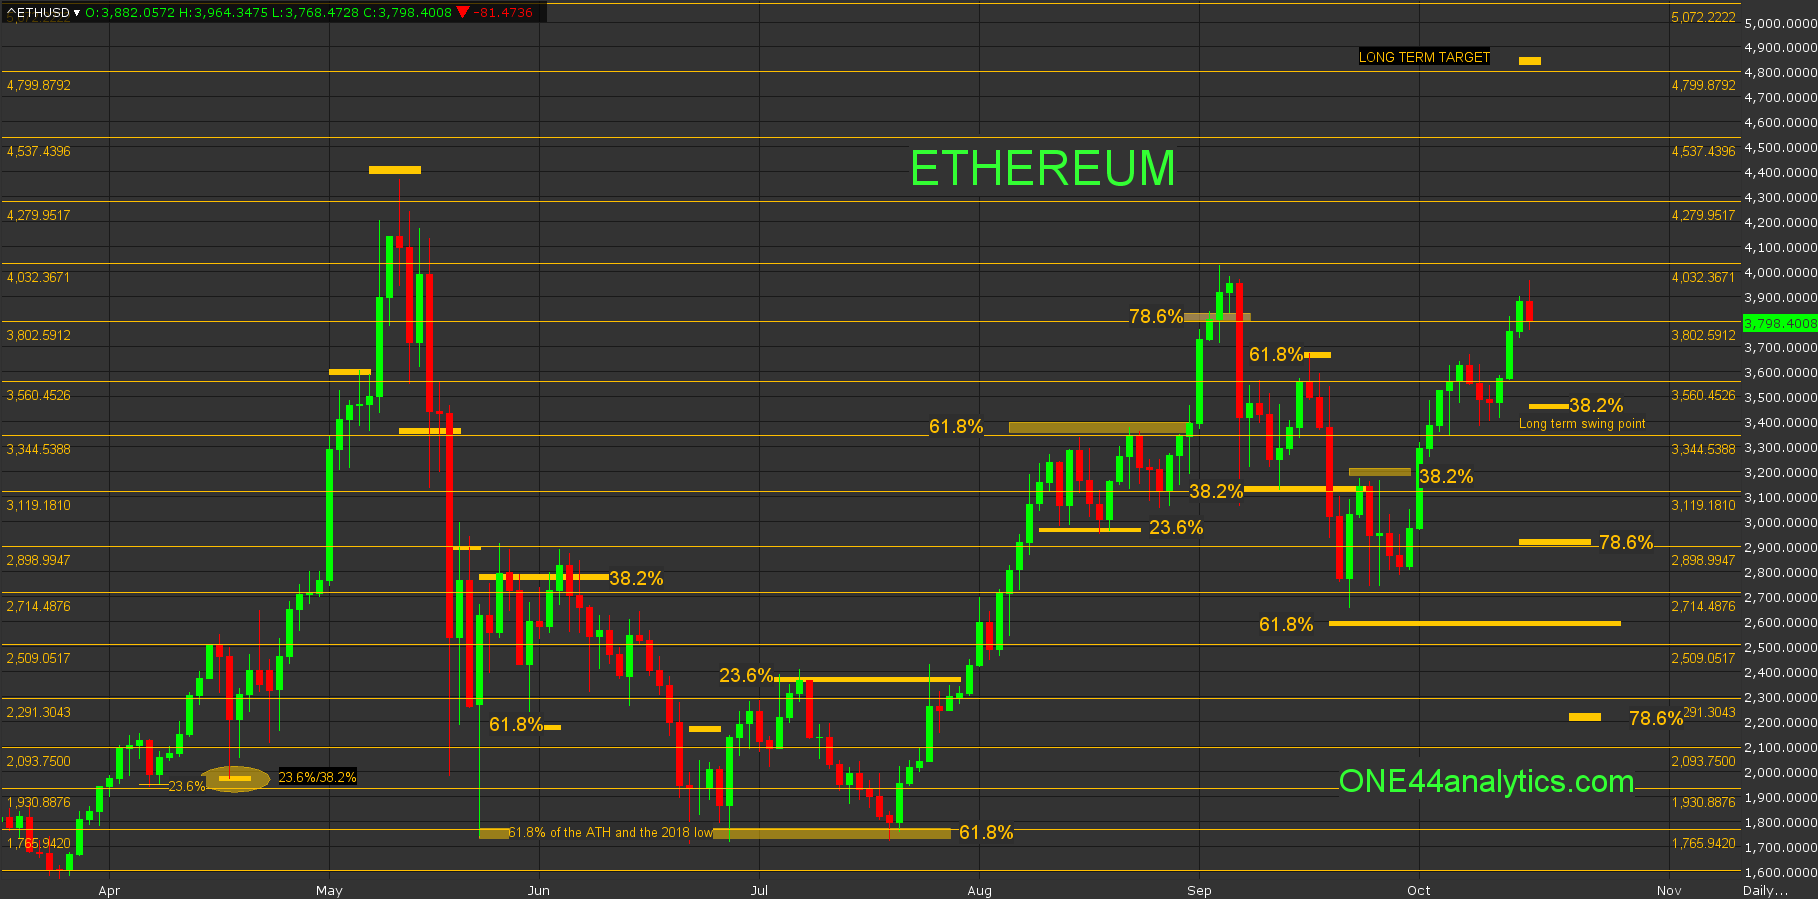
Ethereum
Ethereum has yet to take out the 9/3/21 high, so we are still retracing to the 9/22/21 low and the long term swing point is 38.2% of this low at 3470.00. Above there look for new ATH's and then the long term target of 4840.00. Failing to hold 3470.00 keeps it in a wide trading range and you can look for 78.6% at 2910.00. Before the long term target there are major Gann squares at 4032.00, 4279.00, 4537.00 and 4799.00. On the downside they are at 3560.00, 3344.00 and 3119.00, all of these are on the chart below. They are marked by the yellow horizontal lines.
Sign up for our Free newsletter here.
FULL RISK DISCLOSURE: Futures trading contains substantial risk and is not for every investor. An investor could potentially lose all or more than the initial investment. Commission Rule 4.41(b)(1)(I) hypothetical or simulated performance results have certain inherent limitations. Unlike an actual performance record, simulated results do not represent actual trading. Also, since the trades have not actually been executed, the results may have under- or over-compensated for the impact, if any, of certain market factors, such as lack of liquidity. Simulated trading programs in general are also subject to the fact that they are designed with the benefit of hindsight. No representation is being made that any account will or is likely to achieve profits or losses similar to those shown. Past performance is not necessarily indicative of future results.