Corn, short term trend turns positive
ONE44 Analytics where the analysis is concise and to the point
Our goal is to not only give you actionable information, but to help you understand why we think this is happening based on pure price analysis with Fibonacci retracements, that we believe are the underlying structure of all markets and Gann squares.
For the ONE44 Fibonacci rules and guidelines to help with this article, go here.
Charts are courtesy of Barchart.com
Corn
Below is the update from 10/17/21, we will follow up on that in today's update.
Today,
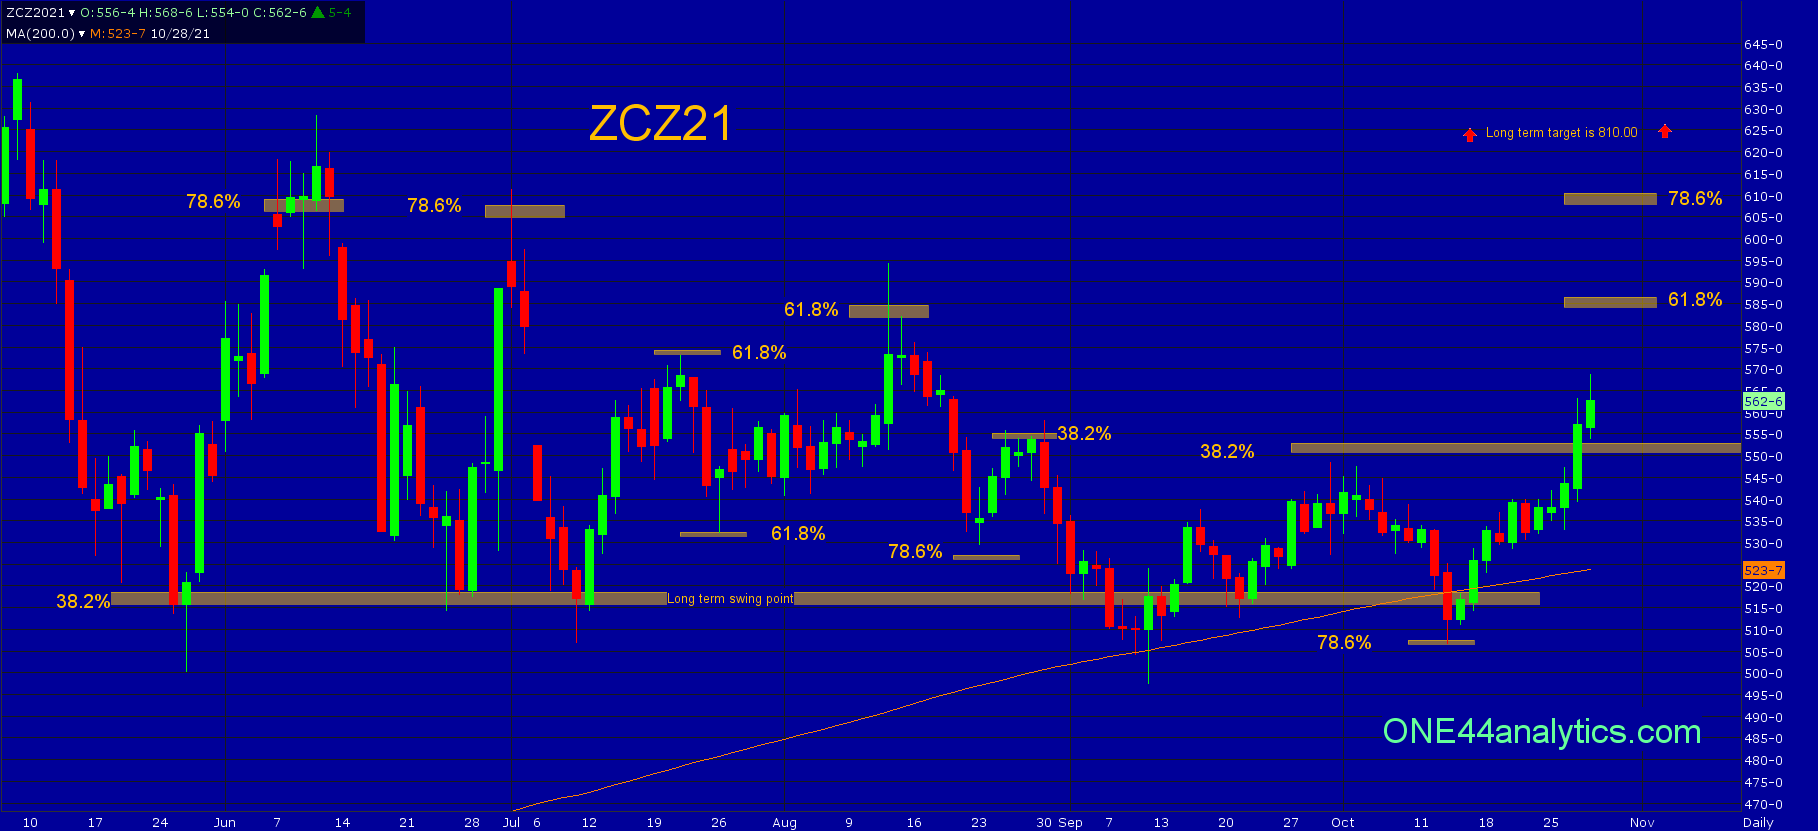
The high on 9/30/21 was just shy of 38.2% at 550.00, using the ONE44 Fibonacci rules and guidelines we should have been looking for new lows to keep the trend negative and any time it fails to make that new low the target becomes 61.8% (585.00) of the same move. It did have one solid close below the 518.00 long term swing point, however it hit 78.6% at 507.00. Following the 78.6% rule we know,
Any market that hits 78.6% should go 78.6% back the other way. This is also where a lot of Bull markets end and start.
So, to start it should have gone to 540.00 to complete the 78.6% target and the second part of the rule tells us this could be the start of a new Bull run and we can look for even more than the 585.00 target based on the 38.2% rule.
By being above 38.2% (550.00) it turns the short term positive and you can use this as the swing point for now. Above look for 585.00 and then 609.00 and with a close back below it look for the long term swing point of 518.00.
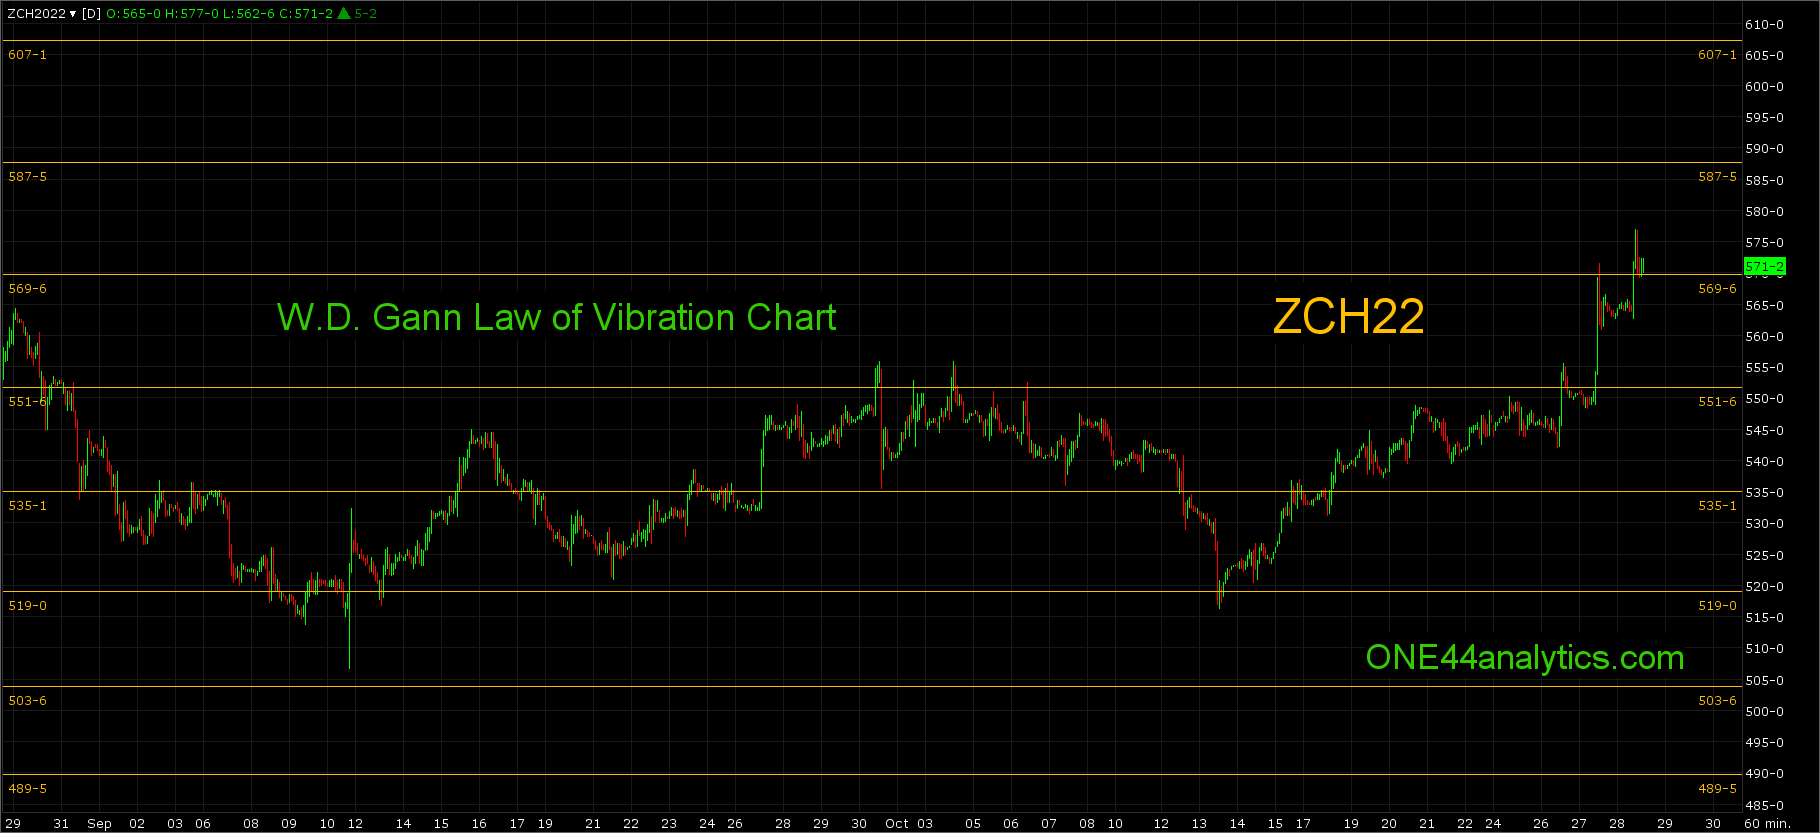
With the trade going into the March contract we have a new Law of Vibration chart below, you can find these charts updated each day for free on our website under GRAINS
10/17/21
Once again Corn had a couple slight closes below the long term swing point of 518.00, this was also the 200 day moving average and then closed back above it on Friday. The trade below 518.00 did hit 78.6% at 507.00 and not taking out the 9/10/21 low should send it to 61.8% back to the contract high, this is 585.00. Following the ONE44 Fibonacci rules and guidelines, we know a lot of Bull markets start and end at this retracement, the highs on 6/10/21 and 7/1/21 show this. We will still have to watch 38.2% at 550.00, failing to get above here keeps the short term trend negative. With a solid close back below the long term swing point, look for it to trade down to 61.8% at 445.00.
Sign up for our Free newsletter here.
FULL RISK DISCLOSURE: Futures trading contains substantial risk and is not for every investor. An investor could potentially lose all or more than the initial investment. Commission Rule 4.41(b)(1)(I) hypothetical or simulated performance results have certain inherent limitations. Unlike an actual performance record, simulated results do not represent actual trading. Also, since the trades have not actually been executed, the results may have under- or over-compensated for the impact, if any, of certain market factors, such as lack of liquidity. Simulated trading programs in general are also subject to the fact that they are designed with the benefit of hindsight. No representation is being made that any account will or is likely to achieve profits or losses similar to those shown. Past performance is not necessarily indicative of future results.