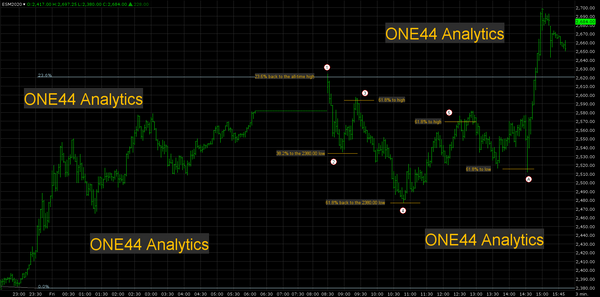
Fibonacci Retracements ESM20 update The S&P retested the long term swing point at 2930.00 and broke again. In general when a market fails to make a new high/low after the first corrective move, the following move should be much bigger than the first. In this case we know that the
23.6 Fibonacci Retracement ESM20 Update Setback holds 23.6% again The break from the long term swing point at 2930.00 took it right back to 23.6% of the rally at 2782.00. The previous low before they hit the long term swing point was also 23.6% back at 2718.00 on 4/
NQM20 This example deals with NQM20 daily chart and the ONE44 78.6% rule. When we use the last long term direct move up from the Dec. 2018 low to the all-time high, you can see that the bottom on 3/23/20 retraced 78.6% of this move at 6645.
Fibonacci Retracements ESM20 update For those of you who have read the Fibonacci rules and guidelines on our website, you would know that once they have reacted from 38.2% the next target on a close through this was going to be 61.8%, this is your 2930.00.
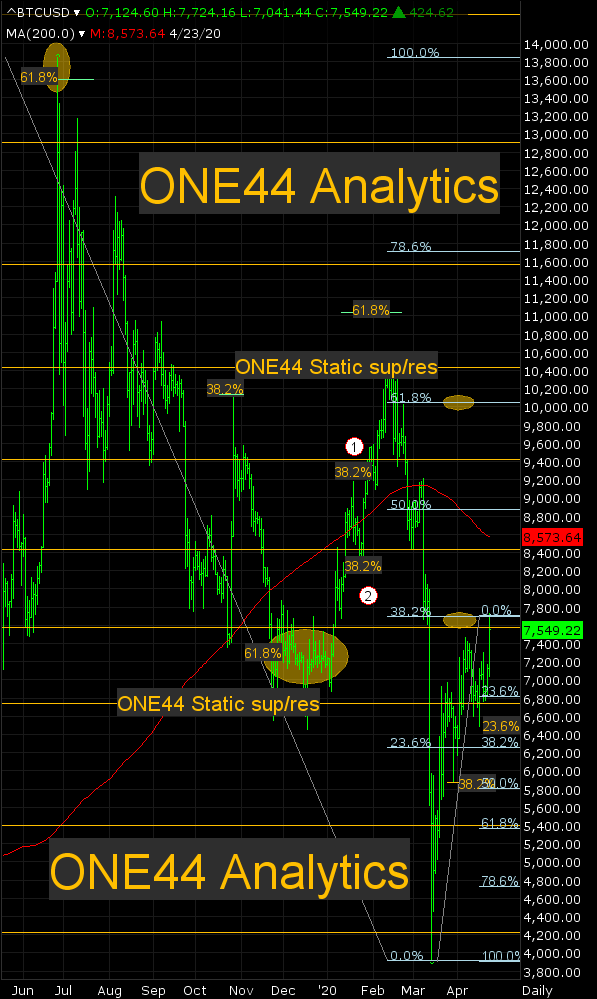
Bitcoin Bitcoin, target hit! The rally in Bitcoin from the major Gann timing on 3/13/20 has now hit the upside target area of the 7600 major Gann square and 38.2% back to the 6/26/19 high, this is 7700.
GCM20 Gold has hit a major target/retracement Gold has now hit the major retracement of 78.6% back to the all-time high and a major Gann square.. A very,very long term target on a break from here based on the 78.6% rule should send it back 78.6%
Bitcoin Bitcoin Target They are now approaching the first target area since the low, this is 7600 to 7700
S&P500 ESM20 update Long term swing point has been hit The S&P closed just above the long term swing point of 2641.00, this is 38% of the break from the all-time high and the 1x1 angle from the Dec 2018 low. It must now stay above this level to give
E-Minis S&P 500 update ESM20 The rally so far from the 2174.00 low has only been able to get up to 38.2% of the break at 2641.00, this is the long term swing point and until it can get a solid close above it the outlook is negative. A break from
Fibonacci Major S&P level ESM20 The major retracement that will tell us if a bottom is in for now, or they go right back and test the lows and possibly more is 38.2% of the whole move down, this is 2641.00. Hitting and or trading above this level and getting right back
Fibonacci Retracements The Fibs don't lie For anyone who may doubt the validity of the Fibonacci retracements and the proper way to use them, you only have to look at Friday's action, one of the most chaotic day's ever to see their value.
GS JPM and GS These two stocks show the importance of the long term levels and what retracement you are reacting from and what to expect. The first thing is we know that 2754.00 is 23.6% back to the 2009 low in the S&P and that this is now our
EXC Exelon Corp. EXC Exelon Corp. backed away from 38.2% of the Dec 2015 low and the all-time high once again up at 51.00. The current break from there has taken them right into 38.2% of the Dec. 2015 low, this level is 41.32, also in this area is
stocks FANG's + MSFT MSFT The key level for MSFT to remain very positive longer term is 38.2% back to the 12/26/2018 low, this is 153.80, the first bounce from this level went up to 175.00. The long term swing point is now 153.80, just below this is
EURUSD Euro second target hit E6H20 The Euro has hit the second target of 1.1460 coming up from the 1.0838 long term target. This area can send it back to test the lows again, at a minimum look for 38.2% of the current rally at 1.1225, if this level holds this
S&P500 S&P 500 update The low this morning so far went into a few major retracements. The biggest was 23.6% back to the 2009 low, this is 2753.00, 38.2% to the 2016.00 low, this is 2792.00 and 61.8% back to the Dec 2018 low, this is 2724.00.
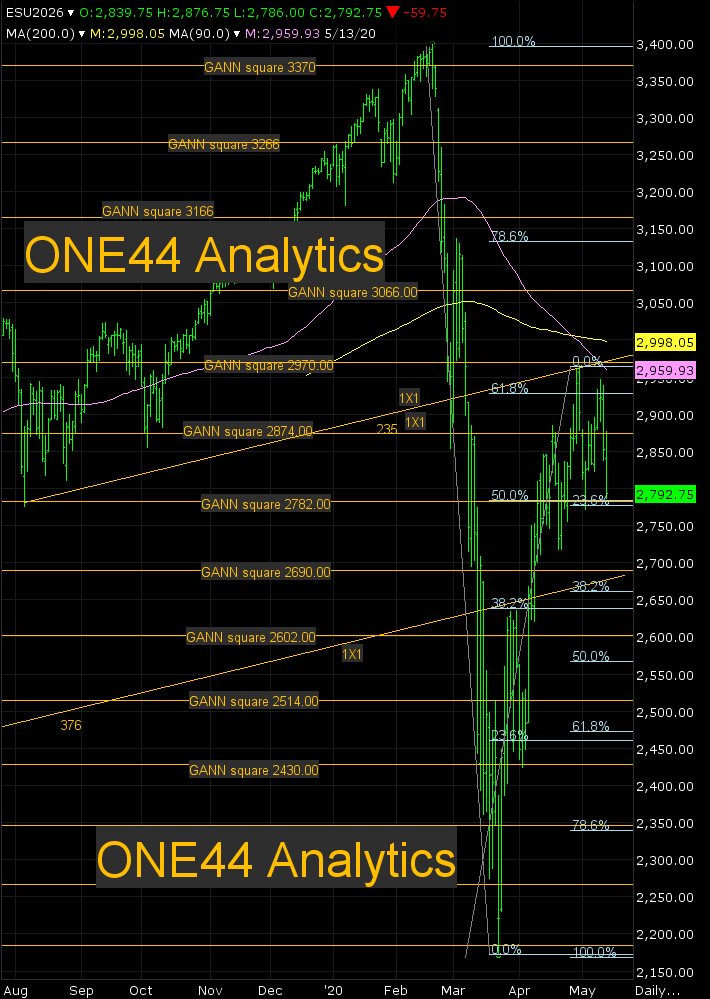
ESH20 S&P 500 new futures low ESH20 Use the 2874.00 major Gann square as the DSP for now, below it look for the 2782.00 major Gann square and 23.6% (2760.00) back to the 2009 low. If this area does not hold you are looking at a much bigger break down to 2350.
Fibonacci Euro bottom update #2 E6H20 The break from the first target of 1.1225 after hitting the long term target of 1.0838 could only get 23.6% back of the current rally at 1.1110. You can now use 1.1225 as the DSP and the next target is a combination of retracements
S&P500 S&P bottom test ESH20 On the retest of the lows, use the 2910.00 1x1 as the DSP for the day. On a rally from this area look for the 2970.00 major Gann square, a close above here would be a very positive sign, even better would be a close above 2992.
EURUSD Euro bottom update E6H20 The Euro is now just shy of the first target of 1.1225 after holding 78.6% of the 2016 low and the 2018 high at 1.0838. This area will tell us if a longer term low is in. It also has the 1.1175 major Gann square
S&P500 S&P bottom update ESH20, With a solid close above 23.6% of the move down at 2981.00, the first test for the S&P to see if a longer term bottom is in, will be the area of 3049.00 to 3066.00. The first is the 200 day average and
S&P500 S&P bottom When you look at the daily chart, it looks like it made a new low below the 2910.00 1x1 and then closed back above the 2970.00 major Gann square, great bottoms in, but this totally belies the days action. From 8:30 to the close it had a
S&P500 S&P target hit The rally back above the 3066.00 major Gann square today hit 23.6% back to the all-time high up at 3097.25 keeping this market extremely negative. They have now hit our second target zone of 2984.00 to 2970.00. This area is critical to the long term