w.d. gann Bitcoin Ethereum update ONE44 Analytics where the analysis is concise and to the point Our goal is to not only give you actionable information, but to help you understand why we think this is happening based on pure price analysis with Fibonacci retracements and Gann squares. You can get all the rules and
Fibonacci Soybean update ONE44 Analytics where the analysis is concise and to the point Our goal is to not only give you actionable information, but to help you understand why we think this is happening based on pure price analysis with Fibonacci retracements and Gann squares. You can get all the rules and
ethereum Ethereum/Bitcoin for the weekend ONE44 Analytics where the analysis is concise and to the point Our goal is to not only give you actionable information, but to help you understand why we think this is happening based on pure price analysis with Fibonacci retracements and Gann squares. You can get all the rules and
law of vibration Crude Oil /Gold Update CLJ21 This week's high of 63.81 fell just short of the 64.00 long term target, this is a major Gann square and 78.6% back to the 10/1/18 high. The first place to look for support on a break from this area is 57.
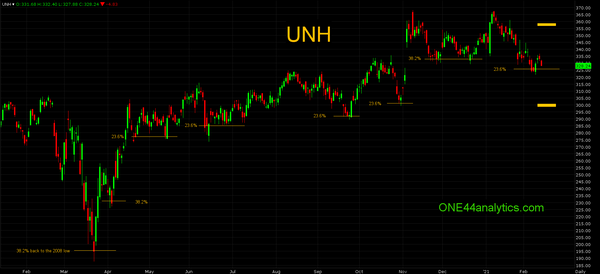
ONE44 Analytics Fibonacci Chart of the Week UNH ONE44 Analytics where the analysis is concise and to the point In our opinion we believe that the Fibonacci retracements are the underlying structure of all markets and in these weekly examples we give educational and actionable information. As usual we will go back to show you where it has
Gold Gold GCG21 The move above the 1895.00 long term swing point fell short of 61.8% at 1972.00, however it did trade through that same retracement on the Nearby chart, this level was 1950.00. Using the 61.8% rule, we should look for a move back to 61.
BBY Fibonacci and BBY ONE44 Analytics where the analysis is concise and to the point We believe that the Fibonacci retracements are the underlying structure of all markets and in these weekly examples we give educational and actionable information. As usual we will go back to show you where it has come from and
Bitcoin Bitcoin The retest of the long term swing at 16,300 on 11/26/20 has now taken the market to just short of our long term target of 24,500. This is a major Gann square. A setback from this area can take it all the way back to the
Fibonacci Corn update ZCZ20 Corn continues to find good resistance at our long term swing point of 430.00. This is 23.6% back to the all-time high and 78.6% back to the 6/17/19 high. The target on a break from this area is 380.00, this is 38.2%
ONE44 Analytics CRUDE OIL CLF21 The long term swing point is 38.2% of the move up from 11/2/20 at 39.80. The 200 day moving average is just below it at 39.50, so to turn the trend negative, I would want to see it close below both levels. The target
wheat Wheat ZWZ20 Wheat did break out of its 4 year trading range, the top end of it was 23.6% back to the 2008 high and 38.2% back to the 2012 high at 590.00. Use 590.00 as the long term swing point now and as long as they
Fibonacci Soybeans ZSF21 The Soybeans have hit the long term target of 1170.00, this is 38.2% back to the all-time high. I still believe this is going to be a multi year rally, but this area can set this market back for awhile. There is a major Gann square at
Fibonacci Gold GCZ20 Gold remains in its trading range of 1850.00 ( 38.2% back to the 3/16/20 low) to 1942.00 (38.2% to the all-time high). They tested the lower end of the range on Thursday and a rally from there should take them up to the top
Fibonacci Gold GCZ20 GCZ20 On this setback from 38.2% (1942.00) back to the all-time high look for the cluster area of 3 major retracements again, they are 1850.00, this is 23.6% back to the 2015 low and 38.2% back to the 3/16/20 low and 1842.
Fibonacci Fibonacci pick of the week We believe that the Fibonacci retracements are the underlying structure of all markets and in these weekly examples we give educational and actionable information. All of the rules/guidelines along with other examples can be found here, https://www.one44analytics.com/fibonacci-retracements-rules/ DKNG This week's pick is Draftkings,
Fibonacci GOLD GCZ20 Like the Oil, Gold is caught between two major levels, on the bottom it is 1850.00, this is 23.6% back to the 2015 low and 38.2% back to the 3/16/20 low. On top is 38.2% back to the all-time high, this is 1942.
ESZ20 ESZ20 Update The S&P is above the swing point of 3266.00 and above 38.2% of the current break (3342.25) which should mean the break is over and it should go for new all-time highs. A key level of resistance before then is the 3474.00 major Gann
Fibonacci Grains Update SOYBEANS In our last update on 9/10/20, this is what we posted... The Soybeans have now had two closes above the 970.00 major Gann square. This is now our swing point. As long as they remain above it, look for 1020.00, this is 23.6% back
barchart trader Bitcoin They continue to trade around the long term swing point of 11,800, the last few days it has closed above this level and as long as this continues look for the long term target of 16,300. A normal break on a failure to stay above this level is
E-Minis S&P Update ESU20 The S&P continues to grind higher towards the long term target and cluster of Gann squares up at 3466.00 to 3488.00. Before this is the major Gann square at 3370.00, once they can close above this level it will become the new swing point,
barchart trader ESU20 Update The 3166.00 major Gann square is now the swing point The break with the close back below the 3166.00 major Gann square on Tuesday was only able to go 38.2% back at 3108.00 keeping the market very strong. You can now use 3166.00 as the
Currencies EURO Update E6U7 The Euro continues to be held down by the 38.2% retracement. The 2018 high was 38.2% back to the all-time high, the high on 3/9/20 at 1.1502 was 38.2% back to the 2018 high and that took it to new lows as it
Soybeans ONE44 Analytics Soybean Update Soybean still under the 38.2% rule Using the nearby Soybean chart, we can look back to the June 2016 high that was 38.2% back up to the all-time high, this level was 1207.00. The 38.2% rule is, "Any market that holds 38.2% should go
Fibonacci Major S&P level ESM20 The major retracement that will tell us if a bottom is in for now, or they go right back and test the lows and possibly more is 38.2% of the whole move down, this is 2641.00. Hitting and or trading above this level and getting right back